HK should resist unwarranted minimum wage encroachment

In a significant policy shift, HK’s Executive Council approved a wholesale expansion of the minimum wage regime (see here), including: 1) annual instead of biannual reviews; 2) adding economic growth on top of just inflation for basis of adjustment; 3) placing a floor on changes, ie minimum wages cannot be reduced, regardless of economic conditions. These recommendations, made by the Minimum Wage Commission, whilst well intended, will severely undermine HK’s ability as a small and open economy to adjust in a rapidly changing political/economic dynamics, and where labour as a production factor is increasingly challenged by technology and integration with China. The timing and direction both bode ill for the city’s wellbeing going forward.

Will HK fast lose its labour competitiveness vs peers?


To put the above ‘reforms’ in context, it is helpful to compare how HK’s current minimum wage numbers stack up against its global peers/competitors. Chart 1 below is ranked from high minimum wage to low order, with the highest 5 in red, the lowest 5 in blue, and the rest in green:

Chart 1:  Minimum annual wage from high to low by country

It is interesting to see that the lowest minimum wages are dominated by Asian economies – Indonesia, Vietnam, India, and Singapore (which does not have an official minimum wage, hence the bar reaches 0 on the chart). On the other hand, the highest minimum wages are found in rich and largely Anglo Saxon jurisdiction such as Switzerland, Australia, NZ, Ireland…


Look at this a different way, we arranged the countries in descending order of ‘average pay : minimum pay ratio’ and below is the outcome:

Chart 2: Ranking of ratio in average income to minimum wage

It appears that financial centre type economies dominate the high ratio end of the spectrum (top 5 in red markers), such as Singapore, US (via NYC / Chicago), HK, Luxembourg, reflecting how finance sector having a disproportionate contribution on the average income of the labour force. On the low ratio end (ie minimum wages set higher relative to average pay, blue markers), we see mostly manufacturing and farming economies, such as Poland, S Korea, NZ. It must be noted that in the above chart, Italy and Singapore do not have a formal minimum wage system, so their ratios are meaningless (so we identify their ratio with brown markers).


Represented in a two dimension way, we can see a norm emerge in the average-to-minimum pay ratio – obviously higher income countries can also afford higher minimum pay, and this explains why most of the countries follow the three dotted trend lines below:

Chart 3: higher the average pay, higher the minimum wage

Do high minimum wage lead to lower economic growth?


But how do we look at the big outliers against the trend? Obviously, the ratio as a measure of welfare is a significant factor that may impact a country’s economic performance, so we plotted this against recent growth record to reach this picture:

Chart 4: 10-year per capita GDP growth are higher in relatively lower minimum wage countries

Again, a clear trend is identifiable, but this time, the trend lines point to higher economic growth for higher average-to-minimum-wage ratios. The most extreme outliers with much higher ratios are labelled in red: Vietnam and China being the starkest examples. On the other extreme, Greece, Brazil, and Japan are lagging the most in economic growth coinciding with their respective low income ratios (blue label text).

Tax rates go up with lower welfare, reversing beyond a certain point?


We next explored how the relative level of minimum wage impacts the tax rate of its host country. The result is not so linear at all – one would expect the higher the average-to-minimum wage ratio the less the welfare burden would be, and therefore the lower the tax wedge should be. However the trend is the reverse – we see below that as the ratio increases from 1.5 towards 3 (ie from Poland towards Japan), the actual tax wedge increased:

Chart 5: Tax wedge against average-to-minimum wage ratio

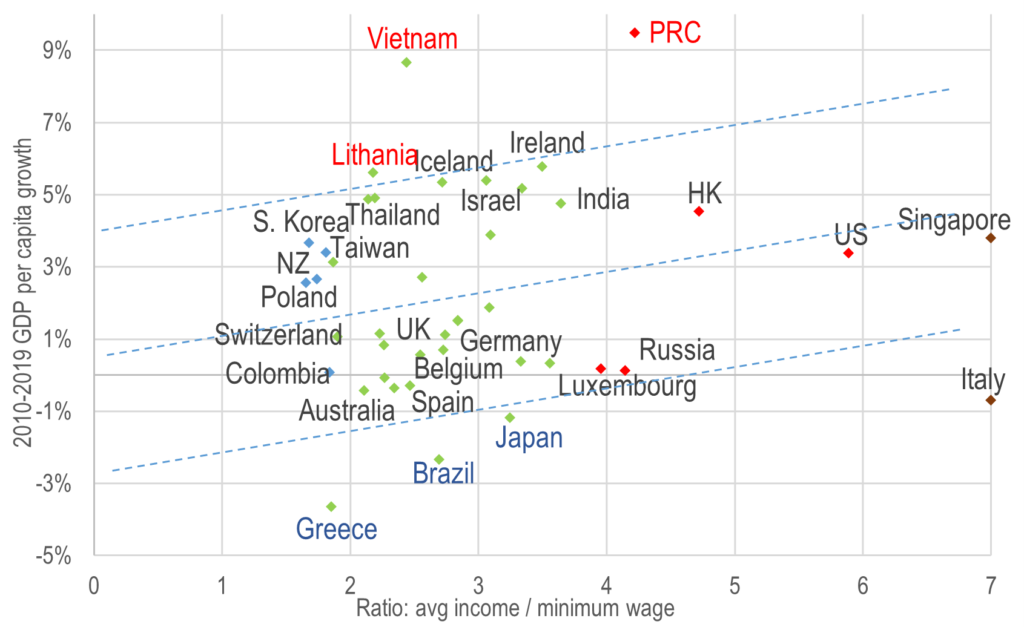
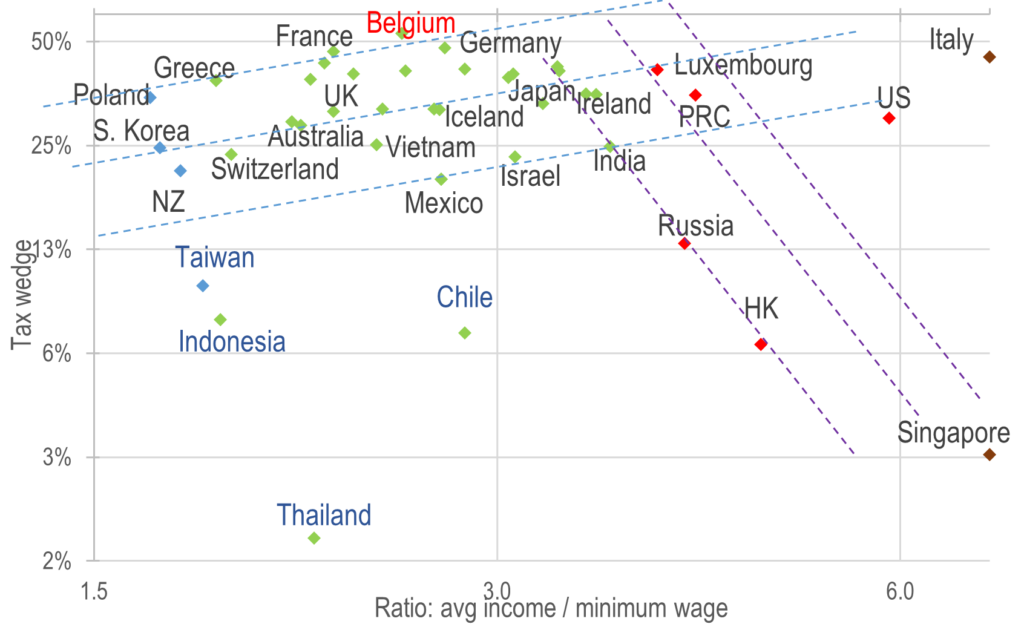
The rising pattern follows the blue trend lines until we hit a much higher ratio value around 4 (ie Luxembourg levels) when a new trend emerges that starts seeing tax wedge dropping again (purple trend lines) – does this mean that if the jurisdiction is rich enough and sticks to a low minimum wage relative, it can avoid needing to raise more taxes to finance this welfare? Or are Russia, HK, Singapore unique exceptions to the rule in the high ratio zone just as Taiwan, Indonesia are in the low ratio zone?

Visible hand always causes unintended distortions

Despite having over a decade of experience with minimum wage administration, the disadvantages of putting such an important economic lever in the hands of bureaucrats is obvious:

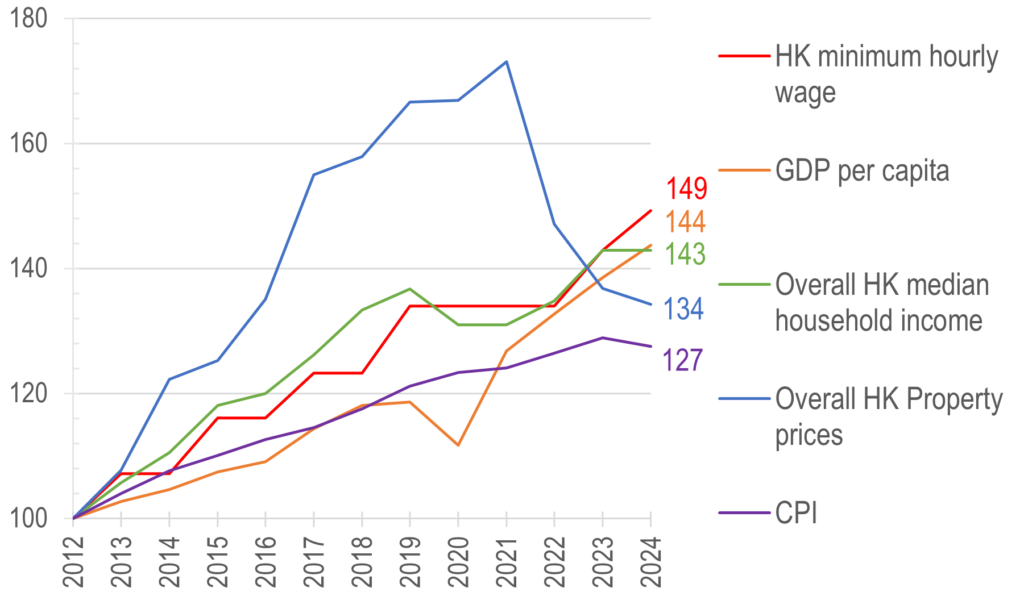
1)     Political pressure rises during volatile asset upcycles – when home prices rise in a bubble (blue line in Chart 6, between 2012 and 2020) however fast minimum wages (red line) are adjusted up by the govt, there will be cries of stinginess, as pay simply cannot catch up with the exponential rise in home prices (thus the wage increases will still be woefully home buying needs);

2)     Private market cries foul in downcycles – although the minimum wage never catches up with private sector pays in the upcycle, note how rapidly private sector pay adjusts to economic downturns (green line in 2019-21, and no doubt 2024+) whilst the govt mandated minimum wage has only gone in one direction: forever rises, causing societal divide and cries of unfairness especially during times of economic hardship. The current proposal of not allowing the minimum wage to fall is not only redundant given past practice, but is also idiotic as it belies basic economic theories!

3)     The govt’s new proposal to benchmark minimum wage to overall GDP growth obviously incorrectly imposes the city-wide total output over what should be a per capita measure in the minimum wage situation. What this means is, if HK’s population grows fast, but overall wage rates stay stagnant, minimum wage will still be lifted irrespective of overall wage levels;


4)     Minimum wage never underperformed CPI (purple line) except briefly in 2014 – this may be why the govt has to ditch CPI as a measure, even though the disinflationary cycle is over thanks to geopolitics and deglobalization, meaning in future stagflation will result in inflation going above wage increases. How behind the curve the people residing in ivory towers could be proven again in the next few years just when the new proposals go into effect?

Chart 6: comparable benchmarks all seem to underperform minimum wages since it’s launch in 2012!

For the sharp eyed reader, the biggest surprise of the chart above is not how minimum wage has been rising too slowly, but how as of now it has risen more than all other alternative benchmarks… does this not actually annul the need for any change to increase minimum wage’s downside protection, but necessitate a more urgent need to ensure it does not detach itself from the wider economy and fairness to tax payers?


We leave you with an illustration of why this form of price control (which minimum wage is a form of) does not work – in a free economy, all types of supply and demand find equilibria wherever the two meet (Chart 7), but in a minimum wage scenario, the willing contributor to supply is banned from making that supply (dark red area in Chart 8), while all legal supply now starts above the threshold (red dotted line), but with less supply in the system, the price response is steeper as a result, with everyone in the system paying more (purple hatched area):

Chart 7: Supply demand without minimum wage

Chart 8: Supply demand under minimum wage

The problems raised by minimum wages are clear to see in recent mandates in the US where thresholds have been raised – in the situations below, either the supply is replaced by automation (the protected worker losing their jobs as a result, Figure 1) or the employer cannot afford extra pay so cutting supply instead (the workers working shorter hours instead, Figure 2):

Figure 1: automation replaces existing supply

Figure 2: … or supply reduction, resulting in workers increasing input intensity?

Source: bizjournals.com

Source: Gary Varvel


The author would like to thank Pan Ming Yue from City University of Hong Kong majoring in Finance and Muhammad Mudassar from City University of Hong Kong majoring in Global Business for assisting in data collection, analysis, and drafting this article.

Leave a Comment

Your email address will not be published. Required fields are marked *

en_GBEnglish
Scroll to Top
Scroll to Top