Lately we often hear how bad the retail scene in HK has become, and indeed a stroll down main thoroughfares around town reveals just how many boarded up vacant shops there are, even in formerly very busy precincts. So how bad has the food and beverage (F&B) landscape been? We take a look at how the numbers and make up of licences in the industry to pin down any emerging trends…
What surprises us initially is how the total number of licences have continued to increase in HK despite the severe lockdowns and the current weak economic performance – at end-2023 there were 33,536 outlets in the city, up a substantial 19% against pre-lockdown 2019:
Chart 1: No. of licences over time, and restaurant receipt changes (grey area)
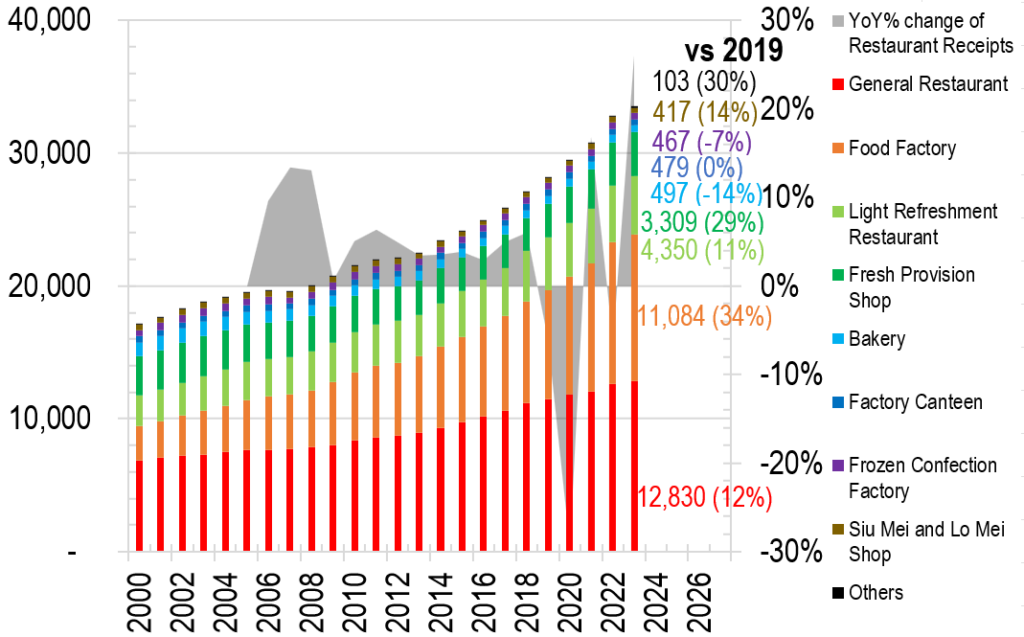
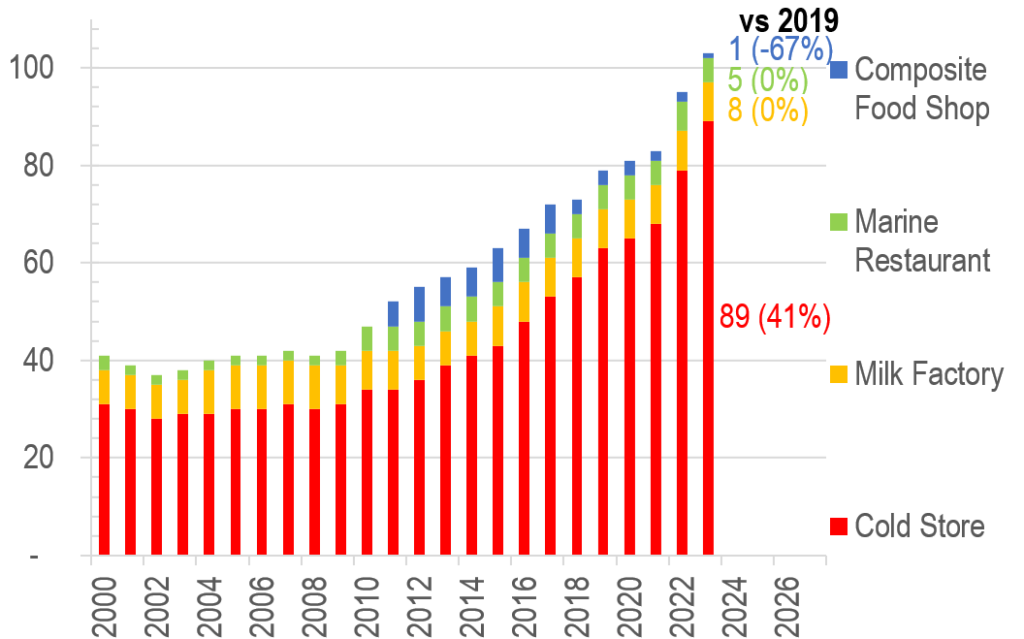
Chart 2: No. of licences – Others sub category
In fact, neither the social unrest nor the lockdowns made any dent in the over army of F&B outlets in HK, whose numbers have basically increased non stop for the past quarter of a century!
Top winners have much to thank harsh lockdown policies
Because of the combined adverse events of the unrest and lockdowns, it is very appropriate to compare numbers against 2019 levels. Amongst the various categories of F&B licences, three strong winners stick out, and they are all beneficiaries of isolation/curfew/lockdown related policies that ruled the ‘covid years’:
a) Cold stores – as lockdowns and work from home (WFH) took grip, more and more people opted to take away and cook at home in the period 2020-22, resulting in a massive 41% spike in outlets that sell refrigerated foodstuffs (red bar, Chart 2);
b) Food factories – along the same vein, food factories swelled by 34% thanks to people buying more ready to serve/cook meals instead of dining in (orange bar, Chart 1);
c) Fresh provision shops – trying to eat healthy and cooking at home (as strict lockdowns prevented dining out) made this type of outlet popular, which as a result rose by 29% in the past 4 years (dark green bar, Chart 1).
Social distancing killed the sweet tooth!
The most unexpected losers in this changed dynamic was how commuters disappeared and with that bakers (presumably people bought their buns en route to work before), which were down 14% (light blue bar, Chart 1), followed by frozen confection entities, may be because there were no birthday parties or office outings, or other celebrations (purple bar, Chart 1).
Viewed in proportional terms, here is a graphic illustration of how each component of the F&B industry fared in the past few years (red arrows = expanded, blue arrows = shrank):
Chart 3: Relative weighting of F&B categories over time
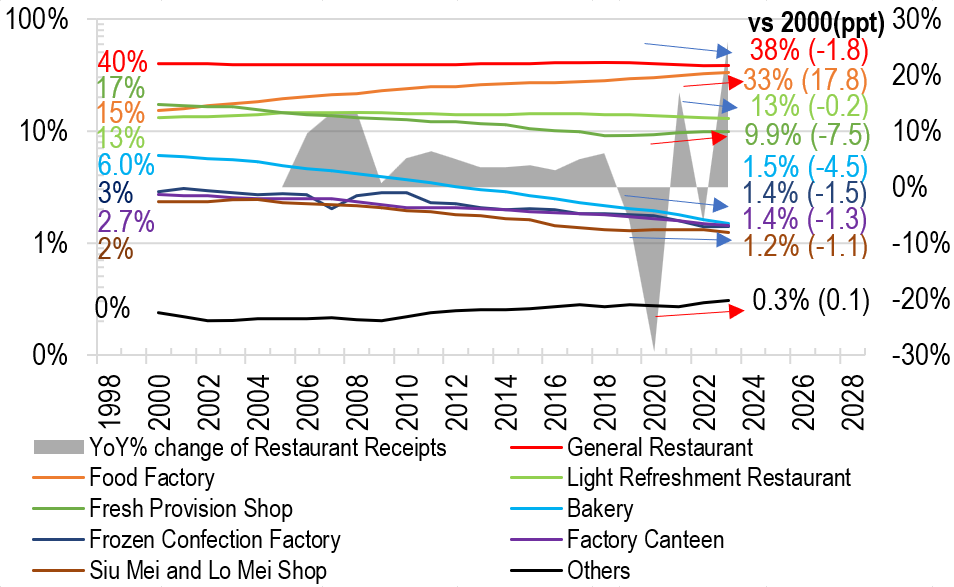
One driver of the rise in food factory category was also due to how consumers have felt poorer in the intervening years, resulting the sudden popularisation of the so called ‘Rice with Two Sides’ outlets, which mushroomed everywhere, and selling each lunchbox set for as low as $25; if you felt like pampering yourself, you might splash out and bought ‘Rice with Three Sides’ for $35!
Retail rent cannot be willed into rising despite the economy
It is easy to blame the landlords for ‘unconscionably’ high rents and coldblooded disregard for retail livelihoods, as is often heard on the media. However, just looking at how restaurant receipts have changed and how sympathetically retail rents have tracked it, one can only say that rents are very much a product of the market – if tenants can’t make money, then so can’t the landlords:
Chart 4: Retail rent index actually underperformed restaurant receipts in the past 18 years
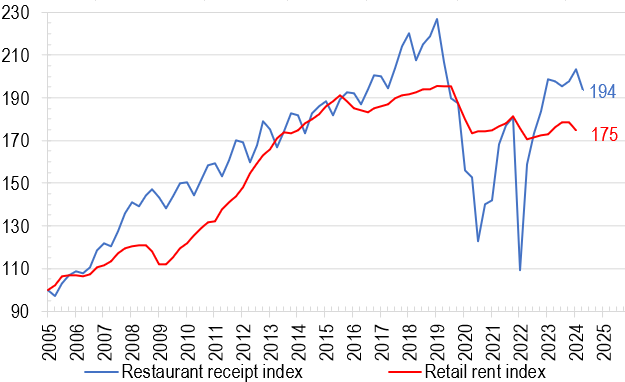
In fact the total F&B receipt index is up 94% since 2005, but retail rents over the same period was up a more measly 75%…
So, if rents are not the culprit of the current F&B malaise, then what is the real problem? We hypothesise that it may be the combined effect of lack of innovation and moving up the value chain, and the southbound invasion by cheap and competitive mainland brands:
Chart 5: Retail rent index vs Restaurant receipt index
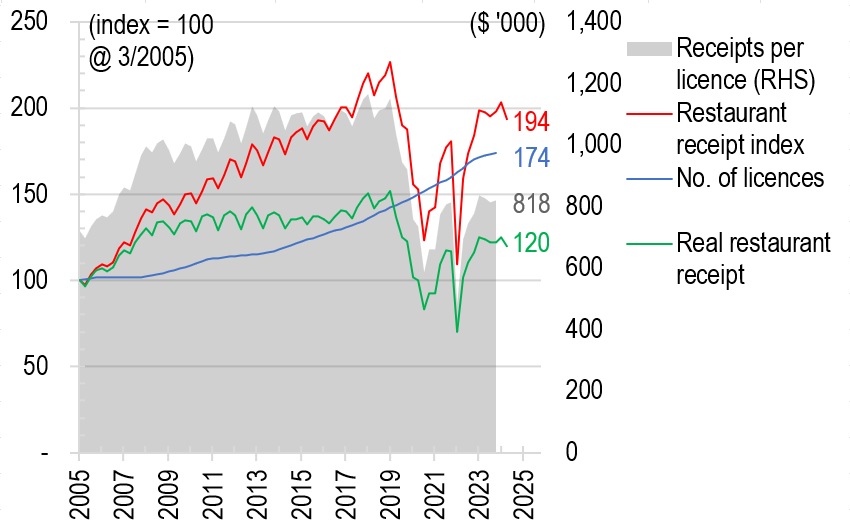
What is clear in the chart above is that despite rising nominal receipts (red line) in the past two decades, the real income has stagnated for most of that period – with no rise at all since about 2008 (green line), then the social unrests and lockdowns became the final straw that broke the camel’s back, taking the real returns for the industry as a whole from 150 to 120 now (ie a 20% decline).
What is more alarming is how the total number of outlets continued to grow despite the savage lockdowns – the licence numbers have basically grown uninterrupted during the whole of the lockdown years (blue line). As a result, the per outlet revenue has fallen a more dramatic 30% from the mid 2018 highs to 818 now.
Perhaps there are mix issues obscuring the numbers – for example more smaller eateries have surfaced while the industry wide capacity is reduced by larger restaurants going out of business (such as whole-floor Chinese dim sum restaurants), not to mention more licences being out of retail premises and residing in industrial properties in the form of factory kitchens. What is certain is that there is a huge amount of recovery yet to take place in HK’s F&B arena before we are genuinely ‘back in business’.
The author would like to thank Huang Ying Fung from Hong Kong University of Science and Technology majoring in Accounting and Finance for assisting in data collection, analysis, and drafting this article.