
Since our 13th May bearish call on UK property, things have not improved on any front, and in this report we update some important macro factors that have either added or worsened the property headwinds the UK is facing. We urge investors to speed up their disposals before it is too late to do so.
Several of the key factors impacting the outlook of UK, and in a sense Europe at large, continue to play out and the current lull (helped by both summer warmth and a temporary correction in energy prices) may reverse unexpectedly when winter arrives. Here are what could happen:
- Energy starvation undermines livelihoods, triggers civil unrests?
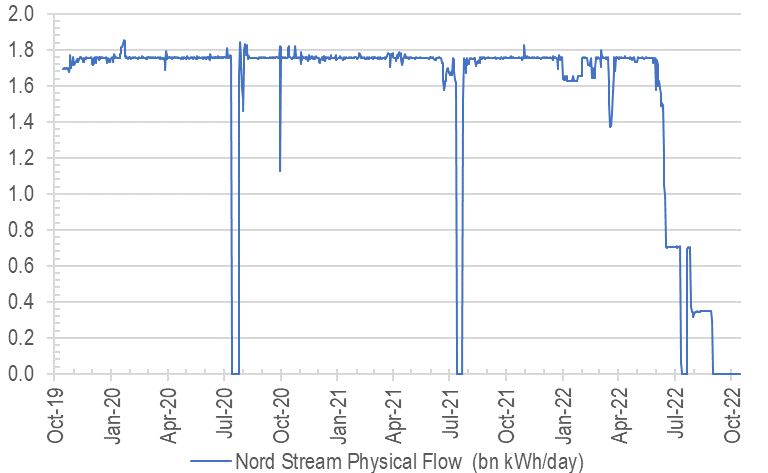
The unfortunate situation Europeans find themselves in can best be described as a combination of: a) political grandstanding in Ukraine where sanctions beget retaliations (energy & food shortage) from its biggest supplier (Chart 1), while b) the zealous embrace of fundamentalist ‘green’ energy policies without having backup plans worsens the hardship that can potentially explode on to the scene.
Focusing just in the UK, our subject market, where 40% of electricity is generated from natural gas in 2021, the energy bills for households and businesses are going vertical (Chart 2). An outcome that would have been avoided if the UK did not gleefully hitch the joy ride that expansionist/hawkish US / Nato policies brought about when diplomatic solutions have been in place since 2014 (ie the Minsk Agreement brokered by France and Germany).
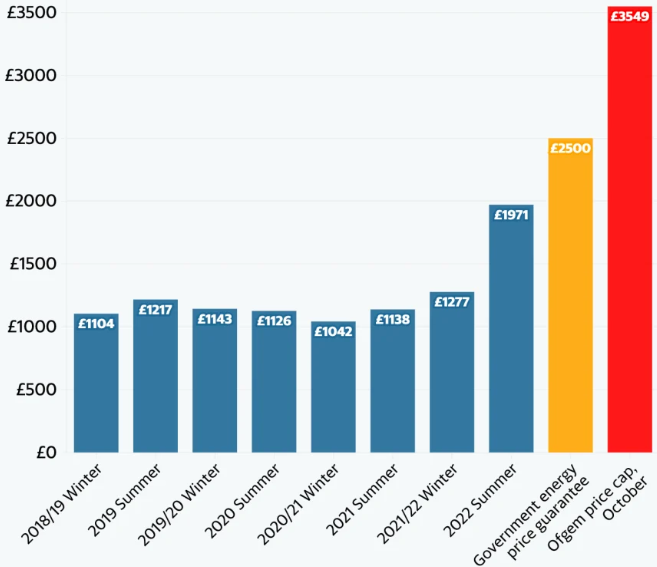
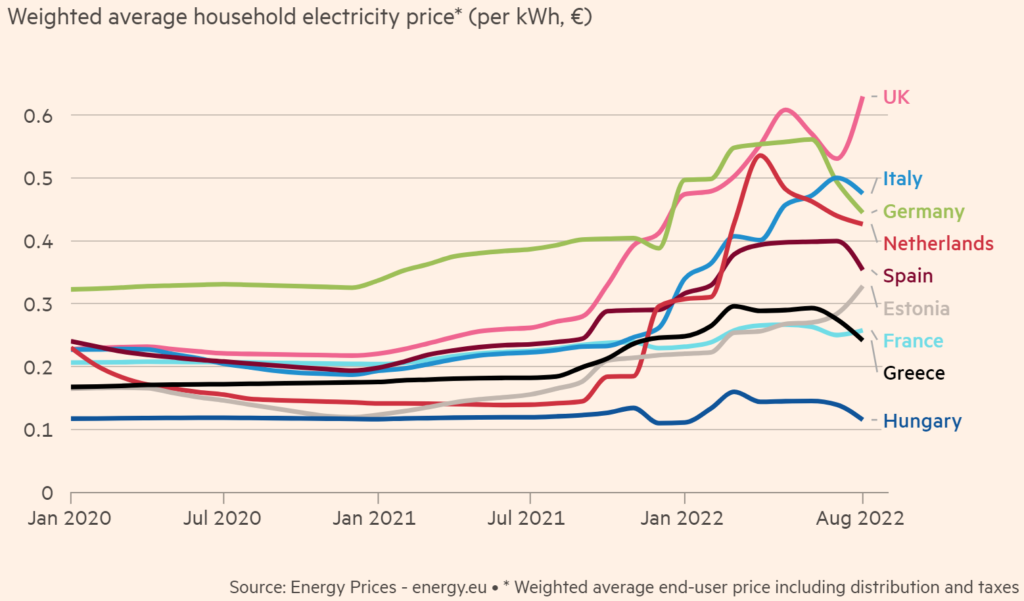
Chart 3: UK electricity price highest in Europe
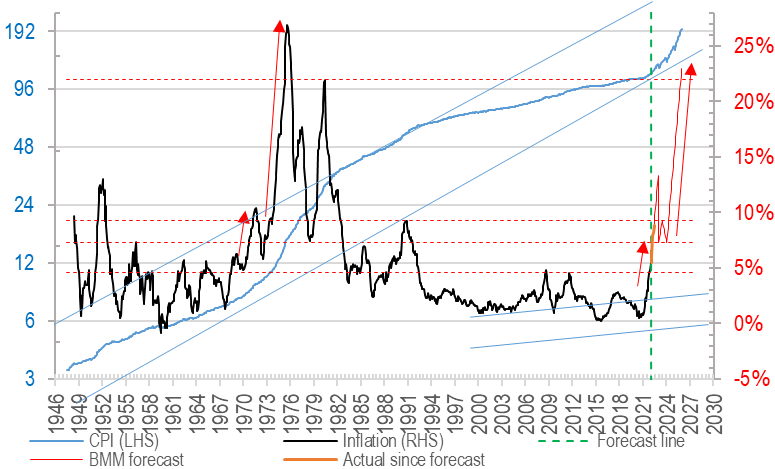
Now European countries not only have to suffer manufacturing stoppages due to energy shortage, but also issue even more debt to relieve household energy hardships at a time when cost of funds are exploding (more below), all while spend unnecessarily on a costly arms race in an unnecessary war which benefits mostly foreign (ie US) energy and munitions producers. This is as close to a perfect storm as it gets, coming on the heels of devastating lockdowns that has destroyed the SME sector in the past three years and ushered in record high inflations (also expanded later, Chart 3) even before the war began…
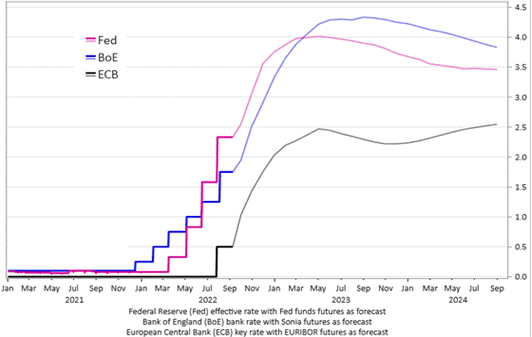
2) Interest rates bursting out of CB control
As the Fed aggressively pursues neutralising rates after years of QE, the rest of the world is dragged along with it, with many EM countries flirting (if not already in) double digit interest rates territory. In the UK alone, it is widely expected now some 250bps of hike is on the cards by Q3 2023 (Chart 5), we fear that might appear mild if the sovereign debt crisis worsens.
This will force a repayment crisis for any home owner on high LTVs who will already be seeing their disposable income drop due to high inflation.
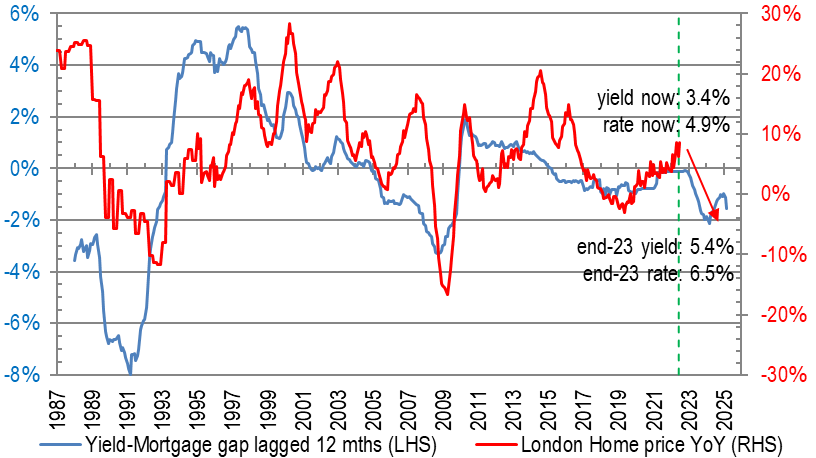
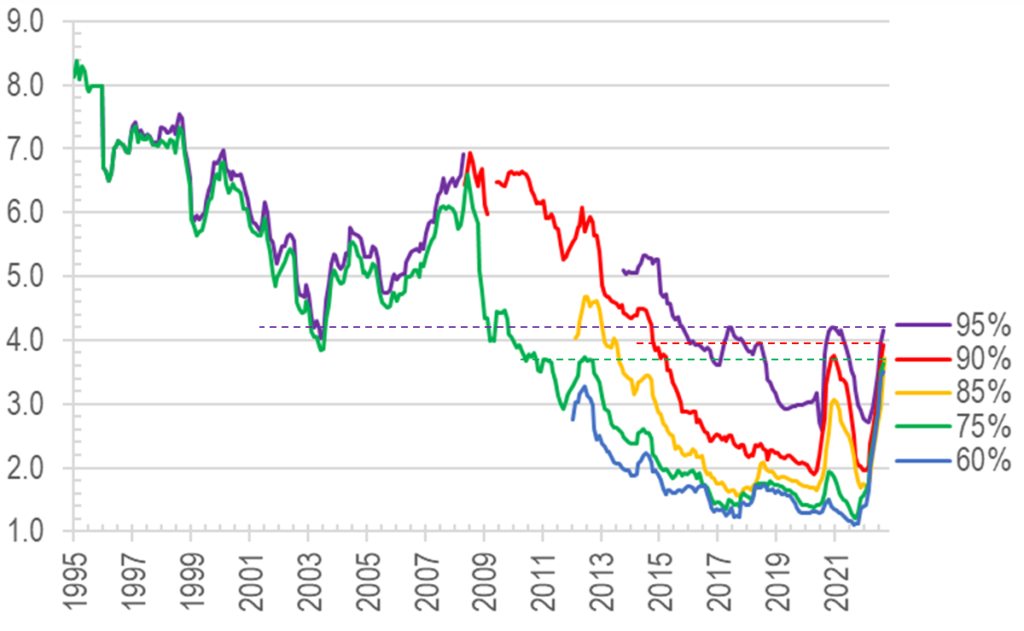
As a result, property yields will have to rise either through big rental hikes (eg in Chart 6 above, c.60% if prices were to stay flat) or some meaningful price corrections heading into 2025. This hike in funding costs will hit even owner occupiers (who may be less concerned with yields discussed just now), as their repayment instalments have only just taken off, and could see multi-decade highs ahead, here is a taste of the rapid ascent and what it looks like:
3) Economic shrinkage unavoidable? Unrest/war wildcards on top…
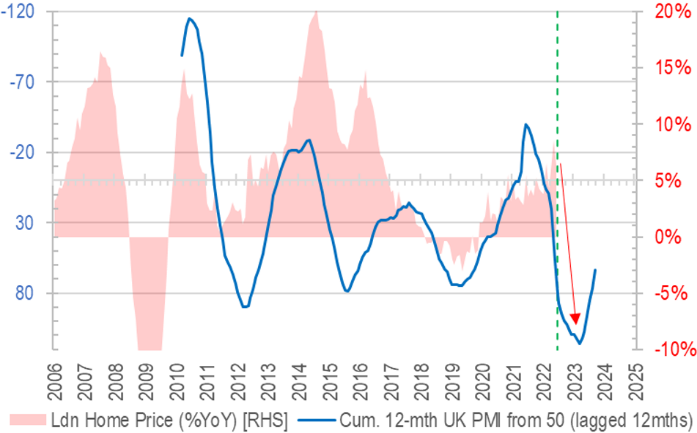
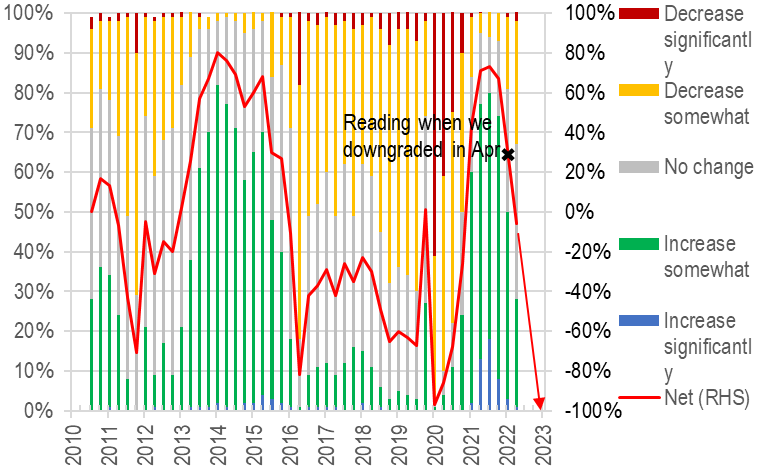
Given the set up of these very unpalatable cocktail, it is unsurprising that our sentiment momentum tracker is suggesting price drops into H2 2023 (Chart 8) and finance directors are getting more bearish (see Chart 9 – again, we expected weaknesses ahead back in May, but this may persist for a few more months to come), which can spell trouble for investments and consumption ahead.
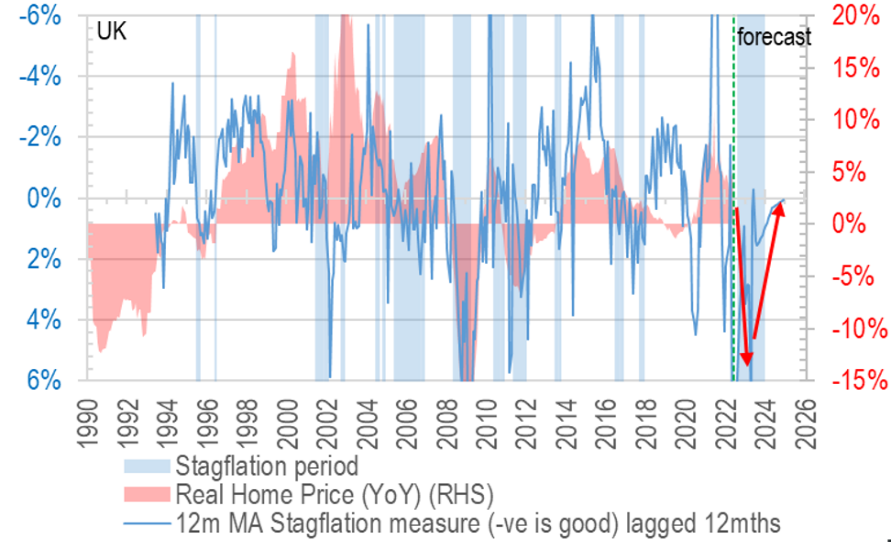
To put all of these indicators on one consolidated view, it is helpful having our ‘stagflation chart’, which encapsulates both the expected weak (if not negative) household income growth and rising unemployment, we see a lot of downside risk indeed:
4) The weaker the GBP, the more imported inflation – a vicious cycle?
On top of the lacklustre macro picture overall, the currency headwinds are not to be overlooked either – as UK suffers the multiple disadvantages of wrong geopolitics and woke/green misadventures, less investment will head for the British shores, or if there were fleeing EU money, they may bypass the British Isles this time and head straight for the USA instead.
What this means is that, especially for foreign investors (which is everyone buying UK property from HK), more currency losses are possible on top of price drops in local currency terms. In fact latest falls in GBP has broken a long term support level that hs held since the 1980s:
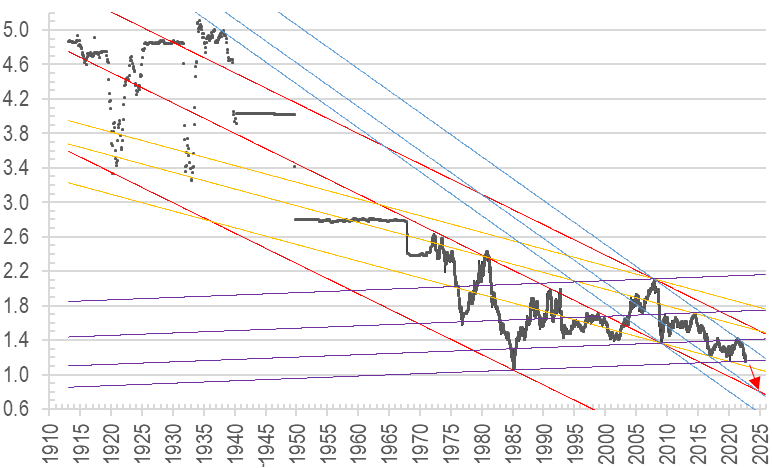
With this major technical breach, we could be looking at the pound reaching 80 cents on the dollar within the next two years, or another 25% devaluation. A familiar Christmas carol paints a serene scene like this:
In the bleak mid-winter
Frosty wind made moan;
Earth stood hard as iron,
Water like a stone;
Snow had fallen, snow on snow,
Snow on snow,
In the bleak mid-winter
Long ago.
Let’s hope this scenario does not come true this winter…and the politicians will have the wisdom to reverse so many bad policies that could result in just such a bleak mid winter indeed.