The SAR government’s launches of new housing policies have reached fever pitch in recent years: from Chief Executive Lee’s “Light Public Housing (LPH)” initiative from his 2022 Policy Address to this year’s resumption of “Private Sector Participation Scheme (PSPS)” that was abandoned in 2002, to the launch of Transitional Housing (TH)… All this begs the question of whether the government has a well laid plan for the long term, or just reacting furiously to show it is doing something to the rising home prices (which has now turned down)?
The stronger the price rises, the bigger the temptation to interfere
Your correspondent has charted all the major public housing initiatives of the past 60 years so as to demonstrate cause and effect, and to illustrate the motives and timing of their launches. The result is clear: whenever major tinkering is made to housing policies, it is often after sharp surges (see brown arrows in Chart 1) or falls (green arrows) in home prices, for example:
a) The introduction in 1977 of the Home Ownership Scheme (HOS) / PSPS (brown arrow A) was after some 133% rise in home prices between 1971 and 1976 (see dotted line 1 on the property price line); this was followed by
b) The Middle Income Housing launch in 1980 coinciding with the end of another period of strong price increases (dotted line 2), but then hastily cancelled in 1984 (green arrow B) when the upcycle turned downwards after a final surge towards the 1981 peak (dotted line 3); likewise,
Chart 1: A timeline of Hong Kong’s major public housing schemes changes
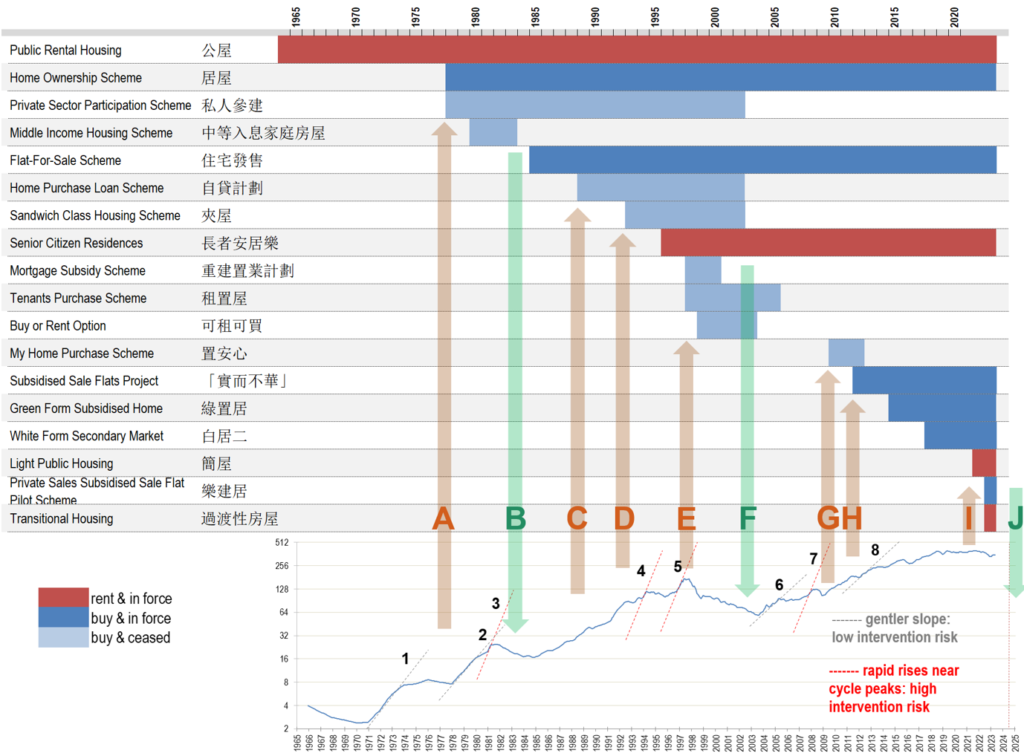
c) The continued home price surge between 1985 and 1994, catalysed several further housing schemes (Home Purchase Loan Scheme, Sandwich Class Housing, see brown arrows C-D), as well as the final blast to mark the peak: the Tenants Purchase Scheme, Buy or Rent Option, and even Mortgage Subsidy (arrow E), all launched before the bubble burst in ’97 (dotted line 5);
d) It was only after the 70% the collapse in home prices around the SARS bottom that the government hurriedly withdrew as many as five housing interventions (green arrow F)!
New up cycles, new intervention temptations
Since the 2003 lows, the return of a housing upcycle (dotted lines 6+7) yet again lured the authorities to launch several rounds of new measures in an attempt to be seen as ‘doing something about affordability’, these included My Home Purchase and the so called ‘practical but not extravagant’ new variety of HOS (brown arrows G+H)… go figure the multitude of nuances in all these fancy layers of welfare!
Sadly for the mandarins in charge, the global zero interest rate environment pushed property prices to even loftier heights, to finally reach a triple top in 2019-2022. This unacceptable situation had to be stopped, so in a flurry of new initiatives, we saw Green Form HOS, White Form Secondary Market, followed by LPH/ Private Sales Subsidised Sale Flat Pilot Scheme/TH amongst others (brown arrow I). All this illustrates is how confusing and short-sighted our housing policy has been, with disappointing absence of logical philosophy on housing welfare provision.
Recent months, the increasing intensity and proliferation of initiatives echoes the same panic last saw in the 1997 peak, presaging that another major top may be in place for this cycle (cf arrow E vs arrow I): at the time of writing, prices have fallen by 12% from the September 2021 highs. Your correspondent fears that in another year or two, there may be a repeat of policy U turns saw at the last major bottom (ie green arrow F vs arrow J)…
In order to illustrate the point on this predictable cycle, we plotted the cause of policy actions (i.e. private home prices, see the blue line in Chart 2) against the symptoms as expressed through the political pressure (quantified by say the PRH waiting time, see green line), and then the result being the number of government interventions (red line). There is an eery correlation of the three:
Chart 2: Home prices leads PRH waiting time, which impacts the intensity of government’s meddling in the housing market
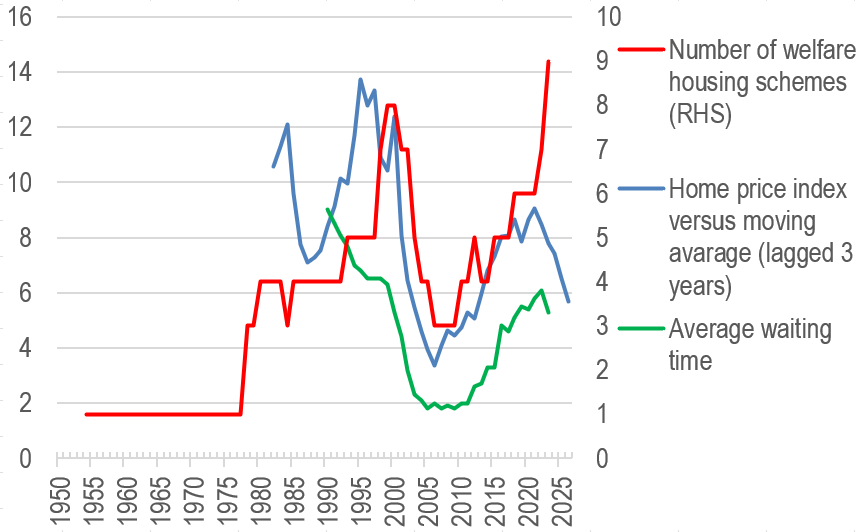
The general pattern seems to be that the number of public housing schemes (i.e. the frequency of market interventions) fluctuates with the length of PRH waiting time; and the latter reflects of the swing between greed and fear as property price fluctuates. The blue line in Chart 2, being a lead indicator, suggests that as the decline in property prices continues, average waiting time will also recede, to be followed by the phasing out of various government schemes around 2025-7 (ie red line will turn down too).
What the above chart also suggests is that government policies are always too little too late, what the various recent interventions/initiatives are already 3-4 years too late, and the drop in home prices will mean that these policies are yet again pro-cyclical, ie increasing price/demand volatility rather than solving the root cause of the problem.
Simple is beautiful – learn from Shenzhen?
Hong Kong’s housing welfare policy/administration has long been held hostage by various vested interest groups, leading to endless proliferation of conflicting policies which only complicate and confuse the people. But across the Shenzhen River, our neighbour has a much simpler public housing set up, with only three layers and minimal overlap with the private market. This enables much more focused welfare delivery with less wastage – a real breath of fresh air indeed:
Chart 3: A timeline of Shenzhen’s major public housing schemes changes
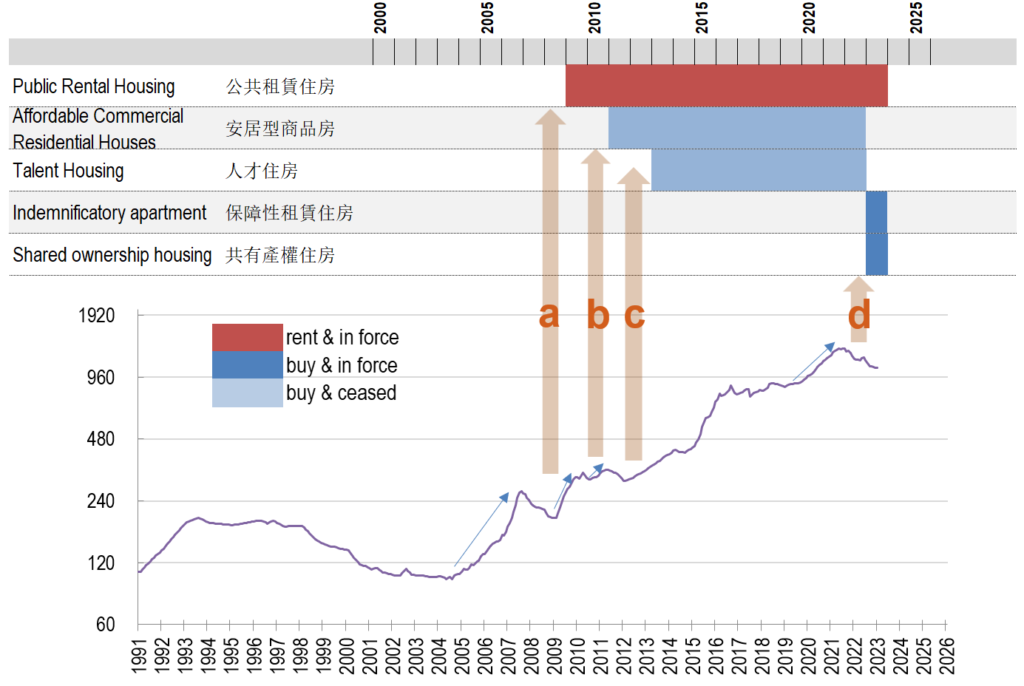
Even though housing policies in Shenzhen seem to be driven strong property price moves just like in Hong Kong (see arrows a-c), but changes to old schemes are accompanied by abolition of obsolete schemes that no longer work. This is strong contrast to the dazzling array of overlapping complexities that typify Hong Kong’s set up.
As a further example, Shenzhen plans to supply/allocate 80,000 welfare housing units (c. 4 million square metres in gross floor area) and 60,000 private units (c. 6 million square meters) in 2023. This translates to a public : private unit and floor area ratio of 4:3 and 4:6 respectively; compared with Hong Kong’s overkill target ratio of 7:3, Shenzhen appears to have a freer housing market!
Policy back to basics: abolish HOS, reduce PRH
Since 1965, Hong Kong has launched a total of 18 public housing schemes, of which 10 are still in force (Chart 1), but the housing problem has only worsened. Not only has public housing policy been widely criticised for exacerbating housing shortage, but has had the adverse effect of HOS breeding more of the “poor” and the “lazy”; this is detrimental to social mobility, but also wastes vast amounts of social and monetary resources.
In view of this quagmire, the government should radically reform as soon as possible:
a) to make available all HOS stock to the private market, this will immediately enlarge supply and can rapidly bring property prices back to more affordable levels; and
b) limit scope of PRH to the most needy, vulnerable group in society (rather than the current 35% of all population!); by releasing land to the private leasing market, even the high rents we see now stand a chance of moderating, thus lessening the pressure on the government to engage in counterproductive market interference.
Chart 4: existing housing benefits a sore sight of complete mess
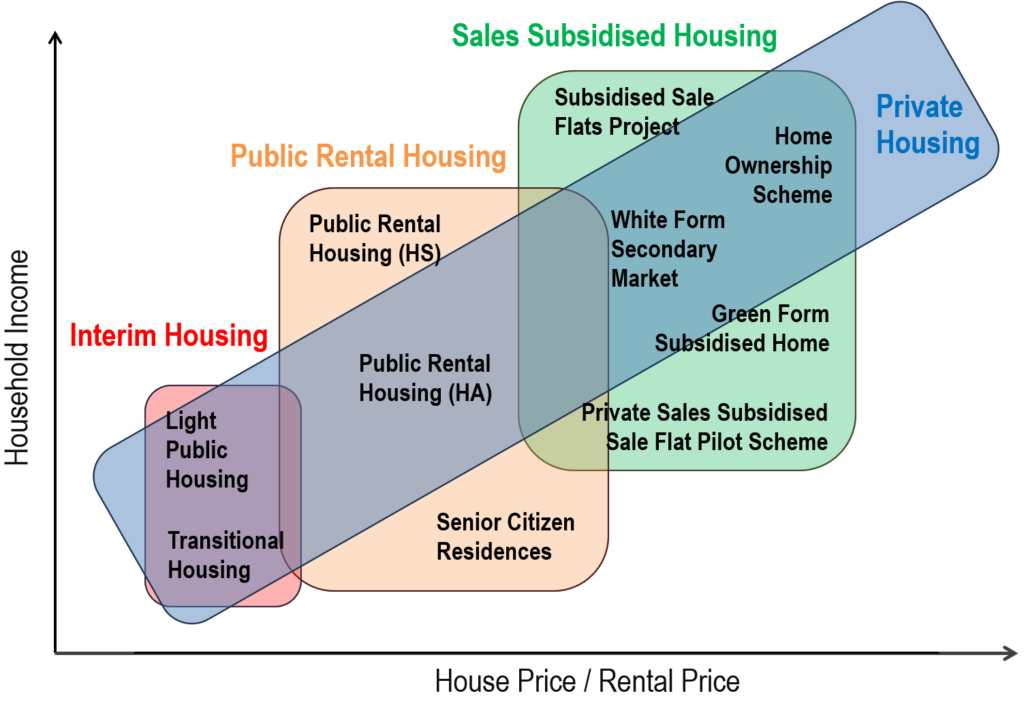
Chart 5: rationalised housing benefits led by private sector removes need for intervention
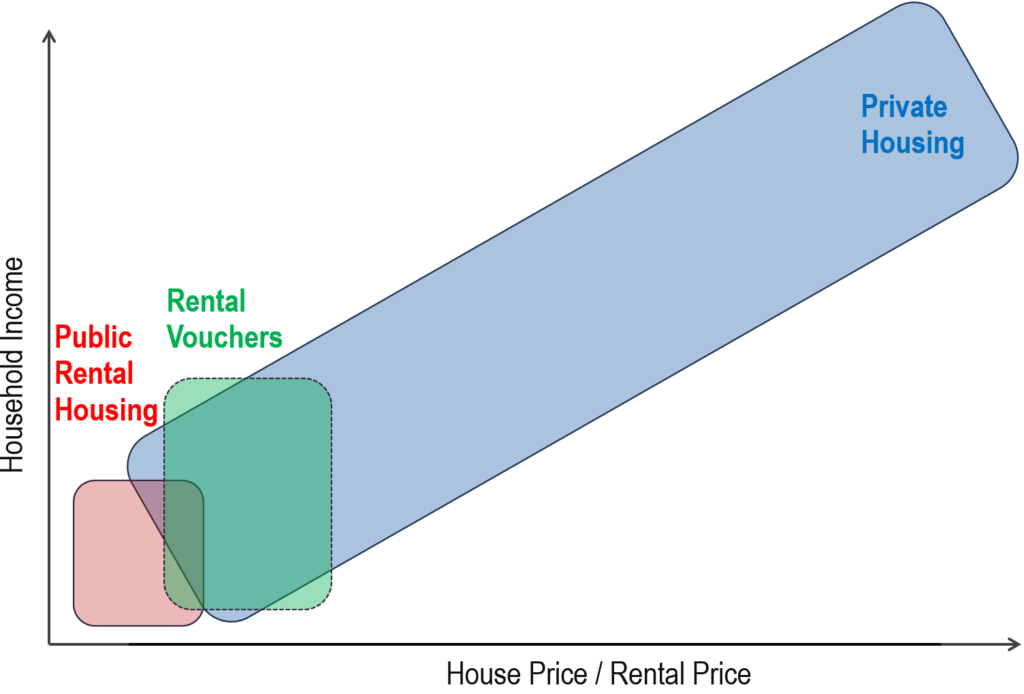
If only the government would allow the invisible hand to allocate supply/demand and prices in housing like so many other commodities are permitted to, then the reason for the existence of such a mess and policy nightmare as shown in Chart 4 vanishes. When returned back to basics, the government’s role will shrink to operating a basic safety net (red area in Chart 5) of physical shelter provision, and perhaps as a transition into the private market, a limited extension into rental vouchers but limited to say 10% of population. This way, even the voucher recipients get freedom of choice in finding the right homes in the right districts, and at the right prices according to the welfare beneficiary. Such an elegant solution will also forever eliminate the endless expansion of bureaucracies, sluggish liquidity/mobility in the housing market, and of course the constant exploitation of an unfair welfare system – a blessing for Hong Kong from every angle one views.
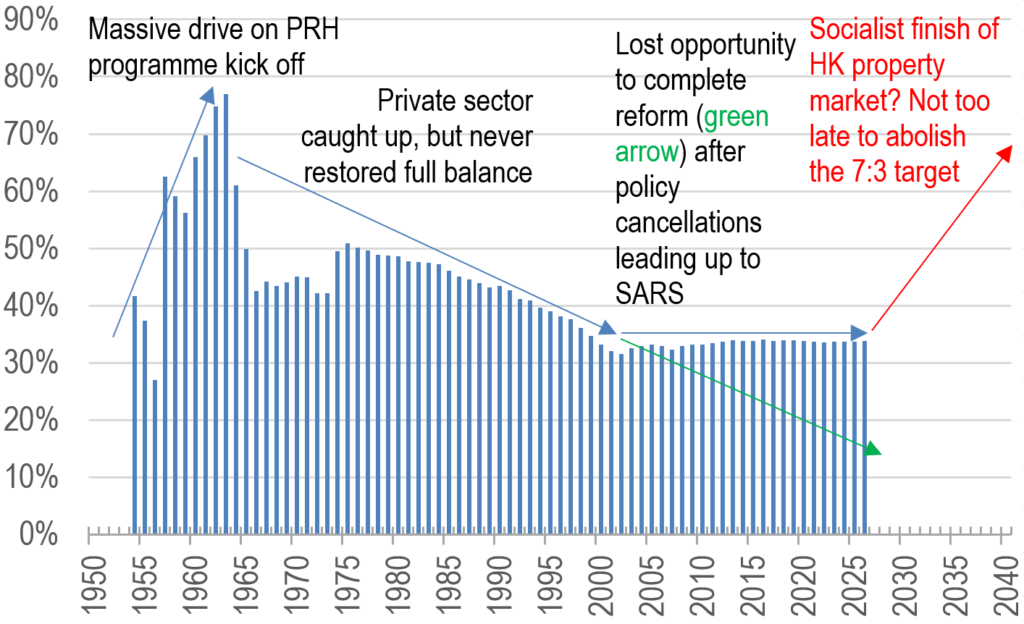
A truly flexible, effective and fair proportion of housing provision by the public sector should be as low as possible, and by no means the 7:3 ratio under current policies (as indicated by the red arrow in Chart 6), by providing low-level safety net physical housing (green arrow) coupled with monetary subsidy for the next poorest group. If Hong Kong continues to imitate badly what Singapore does for its own specific social political reasons, it will only be further left in the dust by a younger, more dynamic neighbour in Shenzhen!
Chart 6: The proportion of public housing is surging again, bad news for future freedom of Hongkongers…
For a revision of some of your correspondent’s past analyses on Hong Kong’s housing welfare, here are the links to recent publications for your reference:
HK’s Ever Ballooning Public Housing Addiction Cycle 11/2021 (Web, Blog, LinkedIn)
as well as some earlier writings in Chinese:
《居屋政策 好心做壞事 2014年7月》English Google translation (Web, Blog)
《公屋改革面面觀─租金偏離市場2014年9月》English Google translation (Web, Blog)
《公屋改革面面觀─結構性自我膨脹 2014年9月》English Google translation (Web, Blog)
《公屋改革面面觀─公屋「豪宅化」2014年10月》English Google translation (Blog)
The author would like to thank Alice Yurong Zeng from the Chinese University of Hong Kong majoring in International Business and Chinese Enterprise for assisting in data collection, analysis, and drafting this article.