
資料圖片,來源:Anthony Delanoix @ Unsplash
It is common knowledge that the bigger the house the higher the price, even though unit prices may actually work in reverse, ie. the smaller the house the higher the per-square-foot price. The phenomenon of higher unit prices for smaller units is likely even more pronounced in densely populated, liquid, and highly commoditised markets like Hong Kong.
In this article, we look at the phenomenon through the eyes of the London housing market. But here, the picture may be more obscured due to a less commoditised (or uniform) housing stock – such as wider variety of land sizes, garden finishes, sun orientations, all factors which could make our size-vs-unit price comparison more difficult.
Landlords can optimise rental income by size bands
We have gathered the asking rent of apartments in a well defined Zone 4 area in London over the past 4-5 years, and the resulting plot shows a very clear relationship between the per square foot (psf) rent and the size of the properties (Chart 1):
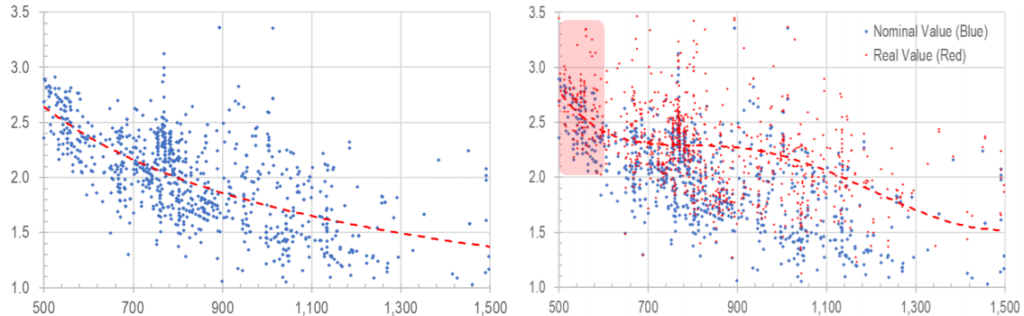
(Left) Chart 1: Rent vs flat size: inverse relationship; (Right) Chart 2: Detrended rents to better find correlation between rent and size
This is just the first step in establishing the relationship between our two variables; in order to eliminate the inflationary effect of rental increases over time, we have applied a discount factor derived from average rents over the same period, and by adjusting older data points by this factor, we can establish a ‘detrended rental series’ which more closely reflects the pure size-vs-rent correlation. The result is illustrated in Chart 2 above, where the detrended (or real) rent are plotted in red while the original unadjusted (or nominal) rents remain in blue.
One obvious observation of the red datapoints is that they are more tightly packed vertically, and therefore reflect a more authentic underlying relationship with sizes of the properties. Other interesting points to note include:
- the biggest unit rent premium is achieved in the 500-600sf region, dropping from £2.8psf to £2.4psf – a whopping 14% drop (red highlight, Chart 2);
- rents then stayed almost flat until just over 950sf when the drop reaccelerates from £2.25psf to £1.6psf around the 1,400sf mark – another 29% drop;
These are very good intelligence/insight for any investors who want to maximise their rental return on investment.
Houses – lower liquidity/transparency than flats
Looking at a nearby neighbourhood where the housing stock is predominantly terrace houses rather than renovated flats, the same rent vs size pattern is also apparent.
However, due to much less emphasis being placed – in the house sector compared to flats sector – on square footage of the premises, there are much fewer listings giving size data for house letting adverts. This may be due to houses tending to offer gardens and other aspects which outweigh purely size considerations for potential tenants. The resulting charted patterns are therefore less representative of the whole sub-sector (hence Charts 3 & 4 showing less dense number of dots).
Interesting observations can nevertheless be made in the house sector – where subdivided lettings (ie <500sf listings – see red highlight, Chart 4) are probably more prevalent, while such segmentation is almost unseen in the flat sector:
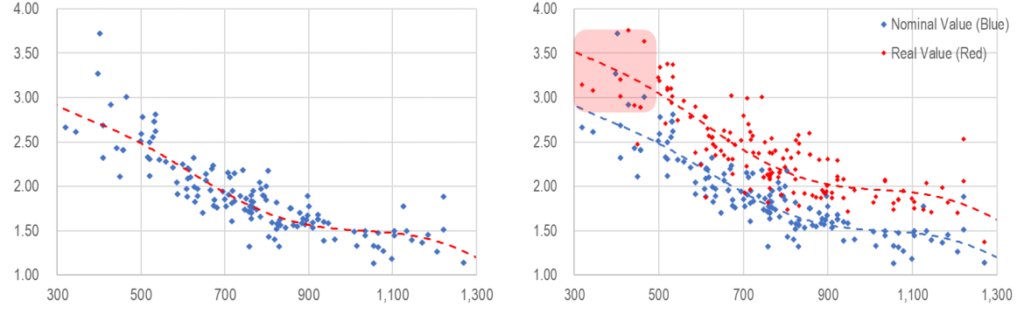
(Left) Chart 3: house rent vs size; (Right) Chart 4: Detrended house rent vs size
Whether it be enterprising house owners subdividing or friends sharing bedrooms in one property, the economics are even better for the landlord, as the unit rent for a 300sf offering could go as high as £3.4psf, and this is for a neighbourhood slightly down market from the apartment district we sampled at the start of this article.
In the overall scheme of things, macro political-economic trends, infrastructure build out, and other local micro factors would of course play bigger roles in affecting how much rent can be earned on any property, and that is where much more work has to be done in advance when investing.
Simple rules as applies to property size
There may be other factors that lend to premiums/discounts on properties (eg each 5 mins walk from subway station reduces rent by say 3%), but in our study here, two linear ratios may be derived for easy consumption by landlords/tenants alike:
- for the flat district, each 500sf flat may have a rent of £2.8psf, with the unit rate dropping by £0.30psf every 200sf increase in size;
- for house district covered above, each 500sf flat may have a rent of £2.9psf with the unit rate dropping by £0.40psf every 200sf increase in size.
In both cases, the non-linear nature of the size-rent relationship makes it difficult for the average retail landlord to set optimal rents, this is why diligence and research are the most useful tools in ensuring the best returns in property – or in layman’s terms: know your market well and stay focused on it.
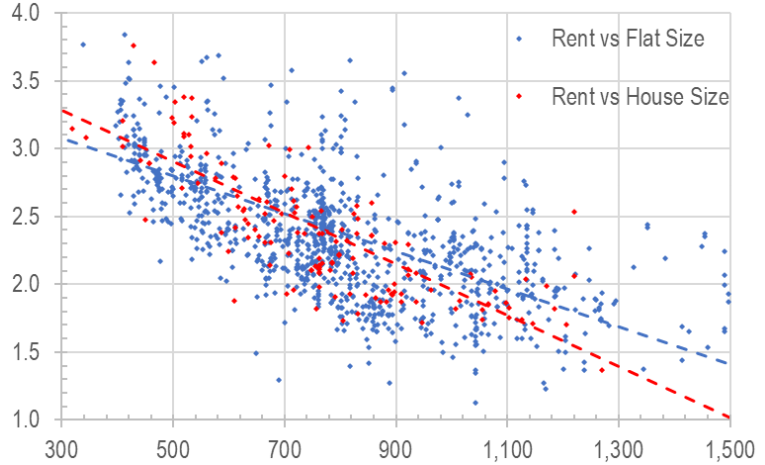
Chart 5: rules of thumb for the lazy: £0.15 per 100sf for flat market, and £0.35 per 100sf for house market
The author would like to thank Samson Leung of Hong Kong Baptist University for assisting in data collection, analysis, and drafting this article.