The global overview – OECD wrecked by an overreaction
The economic disaster lockdowns rendered on especially the SME sector has been well documented, and now we are about to enter another seasonal flu season in the northern hemisphere, it is timely to look at how the global dynamic is as of early September (note maps below represent spot comparison to Feb 2020 levels, so not strictly seasonally adjusted. However, a general picture is still useful for plotting investment moves ahead.
The level of domestic transport is a generic proxy so we will start with this – what seems obvious is the strong growth in Africa (Figure 1), up >20% generally and some >50% – whereas similar geographic regions of S America (very much under the radar screen of media) and SE Asia (also keen followers of Western policies) have fallen significantly by similar extents, showing how policy orientation so dramatically affects local livelihood:
Figure 1: Transport proxy – Africa booming, Five Eyes decimated, SEA collapsed, Greece up
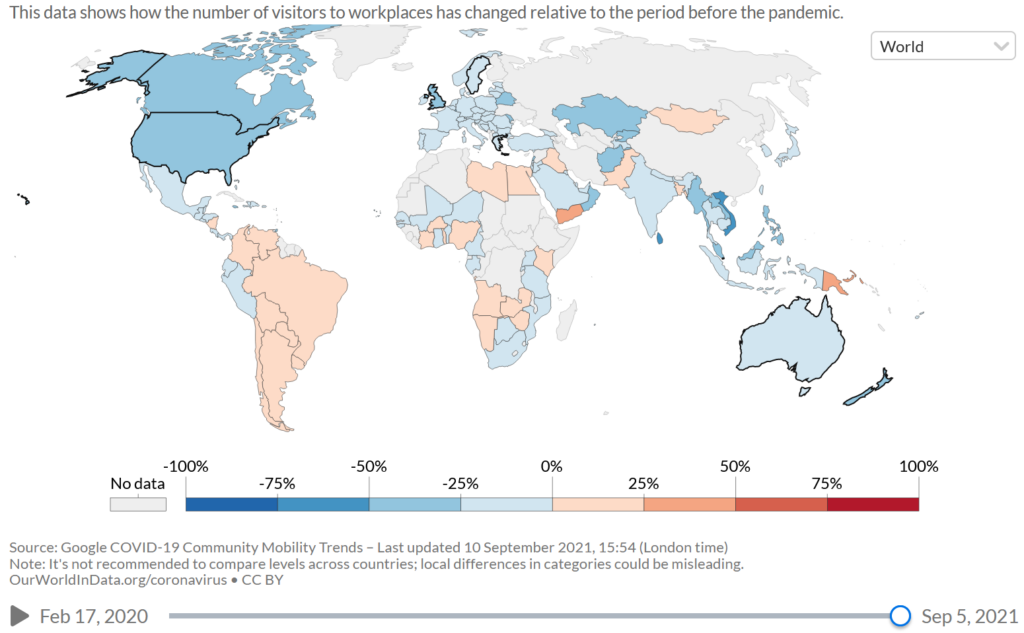
Looking by sector, retail and F&B saw strong rises in Africa and The Middle East, but SEA and Oceania are completely wiped out (Figure 2), and on the more wide economic indicator of workplace visitation levels (Figure 3), S America is up (seasonality?) and Africa is also up, while most of the rest of the world is suffering – again most in the 5-Eyes nations and SE Asia(!):
Figure 2: F&B and retail – Africa up, 5-eyes down – SEA bad
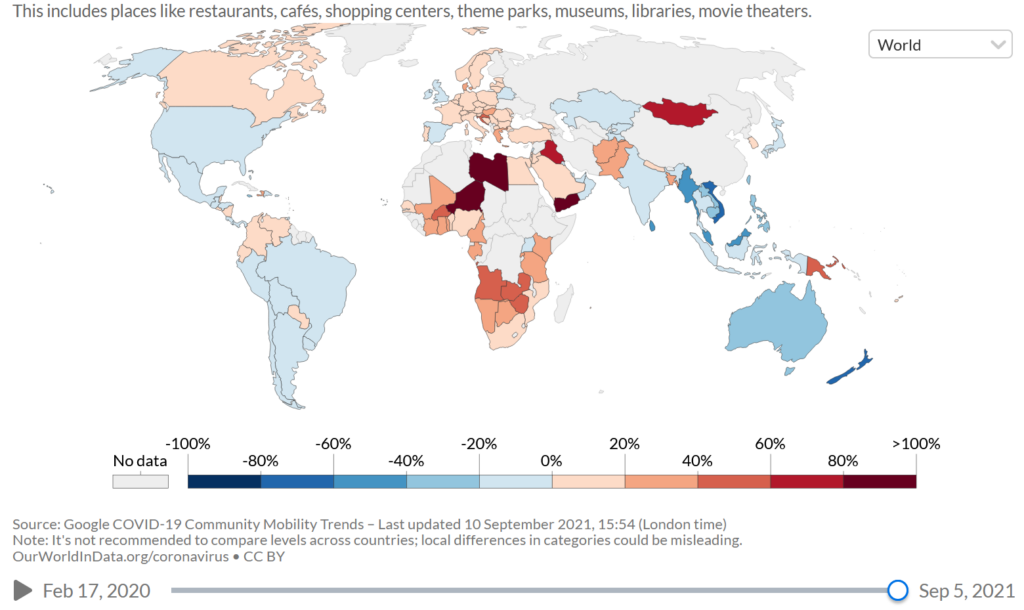
Figure 3: office work – S America back up with Africa, RoW destroyed
Comparing cities – HK is almost back to normal, NZ worst hit
Looking at global cities, despite the early draconian shutdown (which is still very restricted on an international level), HK has shown the best recovery in both domestic transport (Chart 1) and office work resumption (Chart 2), both almost back to pre-lockdown levels.
Chart 1: transport in Greece helped by summer crowds, HK best amongst gateway cities
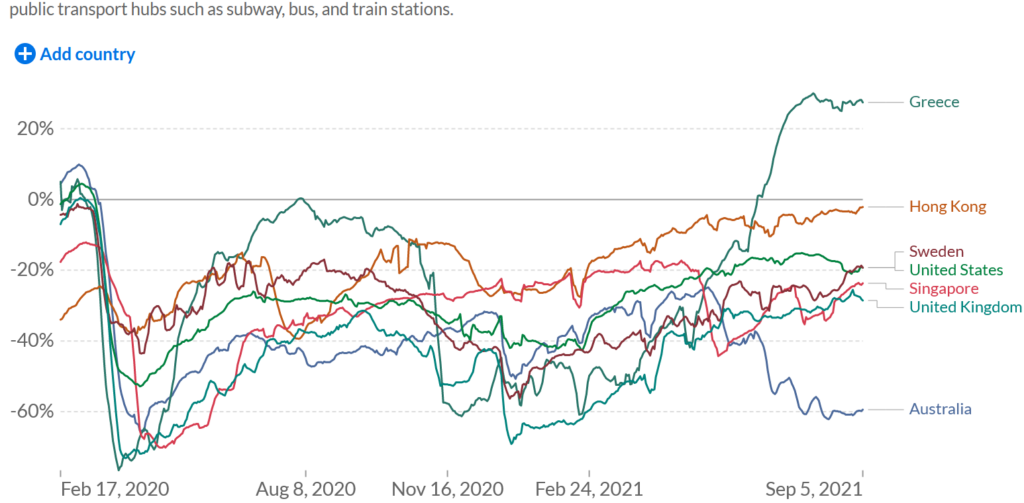
Chart 2: office work – NZ trashed, London & NYC both still well down
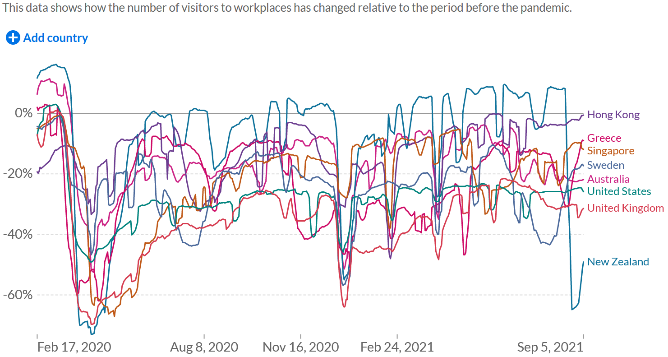
The fervent lockdown efforts of other gateway cities have all left their economies much worse, with Australia (Chart 1) and NZ (Chart 2) prime examples. We put in Sweden as a good benchmark for a jurisdiction which generally pursued an open economy approach throughout the global lockdown craze – but even there it is down by roughly 20% on both measures.
Singapore’s ‘living with the flu’ policy needs more determination if it is not to be rattled by the odd data point that knocks it off its course of recovery.
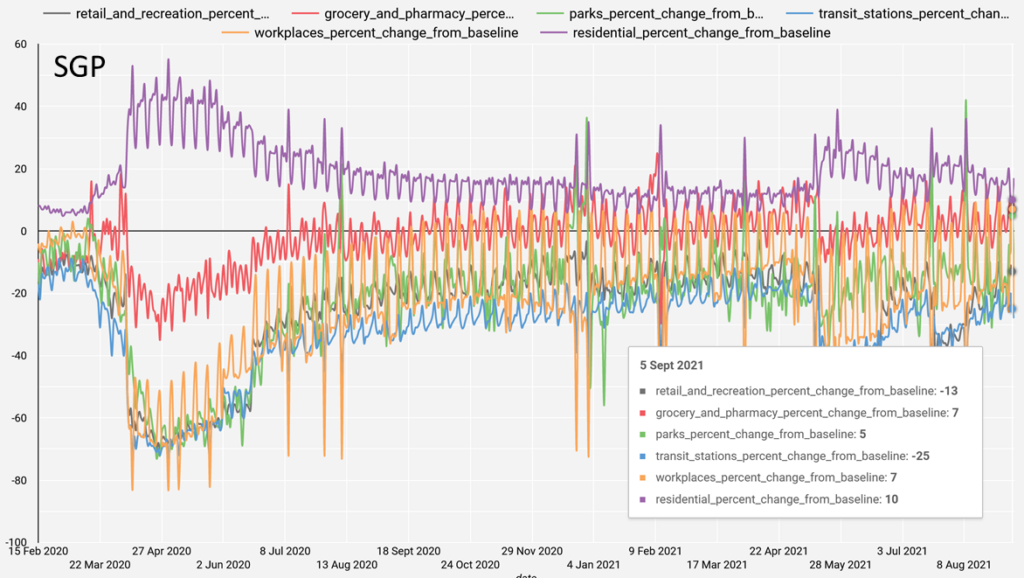
HK vs SGP – HK win
Between the two Asian dragons, SGP should have taken the growth crown given its tropical (ie less flu prone) geography and distance from China the perceived source of the flu, but sadly early policy was too influenced by the bad judgment in the West and it as a result ended up worse off when HK came back strongly in the past year.
HK is now pretty much back to pre-lockdown levels on all measures (Chart 3) park visitation being the only exception (?!), whereas SGP is down double digits still in both its consumption and transport activities (Chart 4), which is sad and unnecessary:
Chart 3: HK: work, retail, and transport back to normal
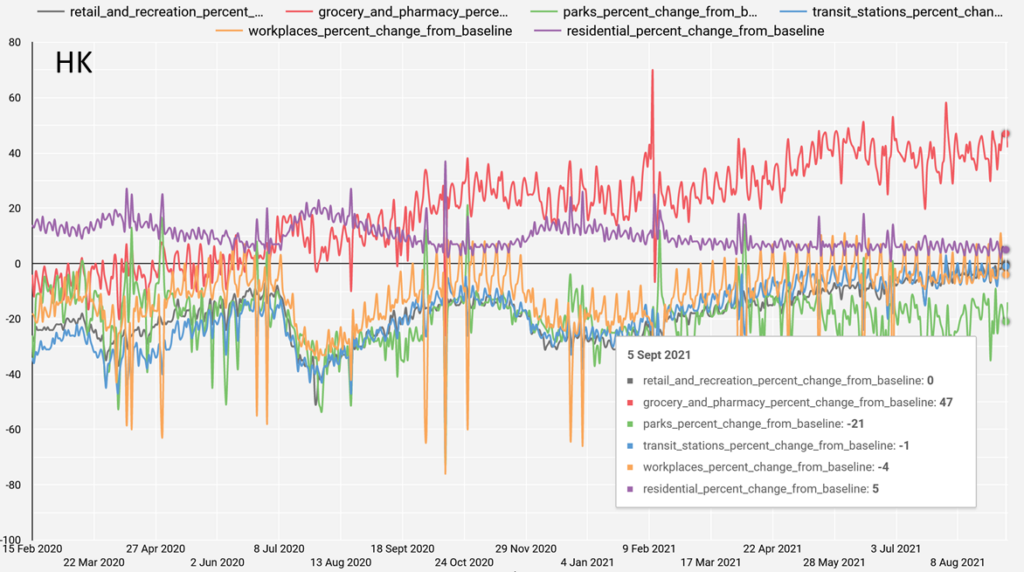
Chart 4: SGP: work up (surprise) despite transport & retail down double digits still
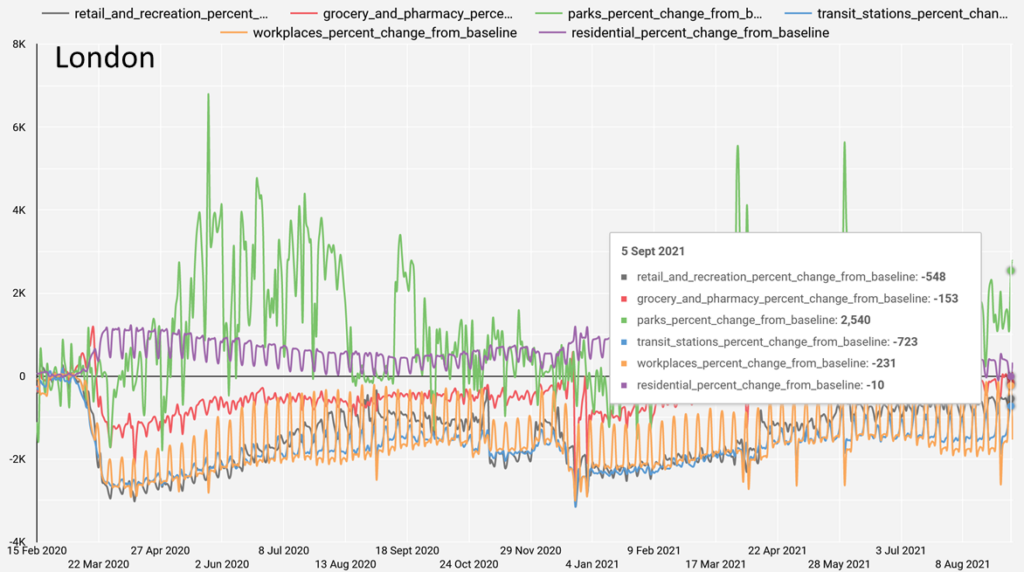
NYC & London the ugly sisters?
While Asia is more or less back to normal, the former kings and queens of NYC and London seem still badly impacted – as shown by the severe drop in work and transport sectors (compare annotation numbers in Charts 5 & 6 vs Charts 3 & 4). Seems most of the people are spending time in the parks (or is it gardens? This is despite seasonality reasons due to the northern summer) instead of at their desks:
Chart 5: NYC: work and transport decimated, everyone hangs out in the parks?
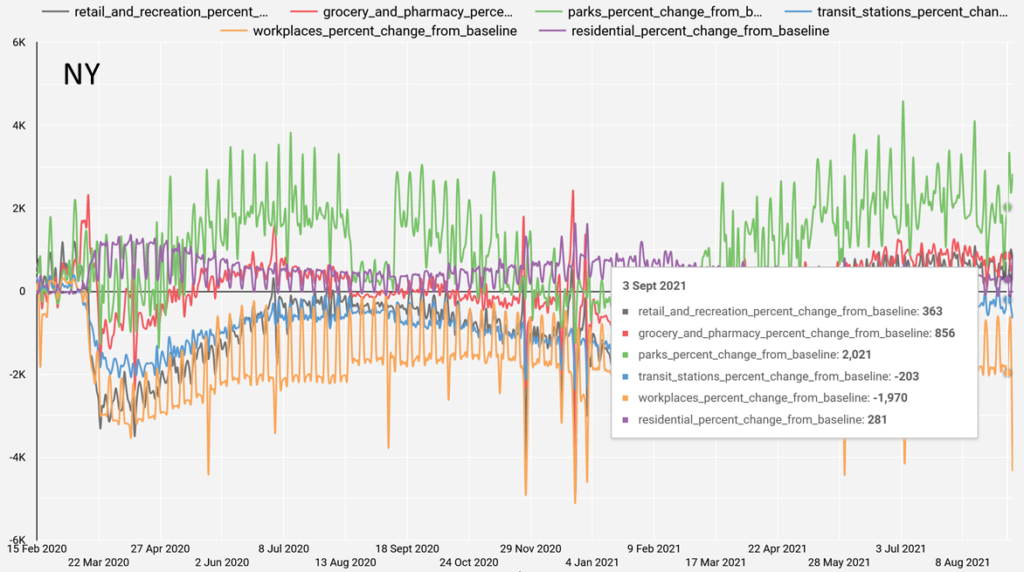
Chart 6: London: same as NYC, the retail sector also killed
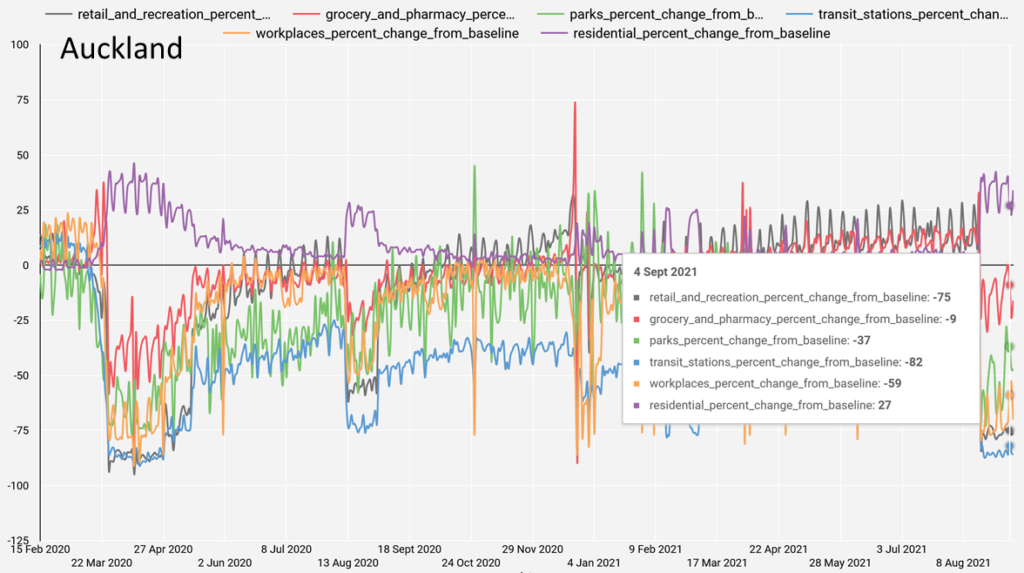
New Fear capitals of the world – Melbourne
Just when you think London/New York are badly hurt enough, wait till you see the damage done to Melbourne, which has probably the most strict curfews seen around the world (fully reflected in the complete decimation of local economic activities: where even residential activities remain down 80% when all over the world they have been up, Chart 7), followed closely by Auckland, where the government shut down the entire country on one single positive test result (Chart 8) – where was any symptoms, hospitalisation, let alone death? Principles of proportionality seem to be truly out of the window when politicians get their hands on absolute power.
Chart 7: Melbourne – the lockdown capital of the world…? Chart 8: Auckland: killing the whole economy for 1 single positive test?
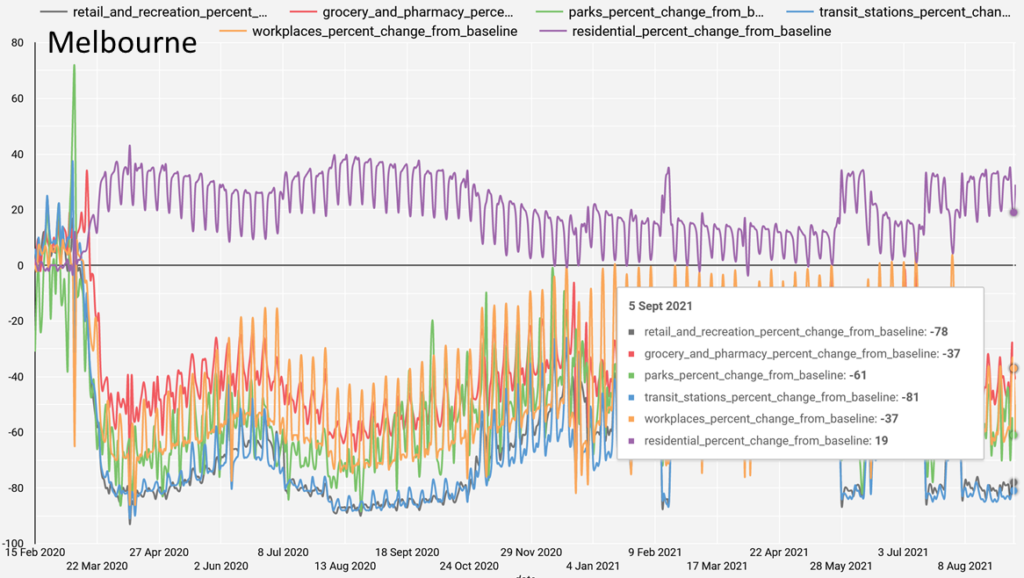
Chart 8: Auckland: killing the whole economy for 1 single positive test?
So whereto can one flee from these prisons of extremes?
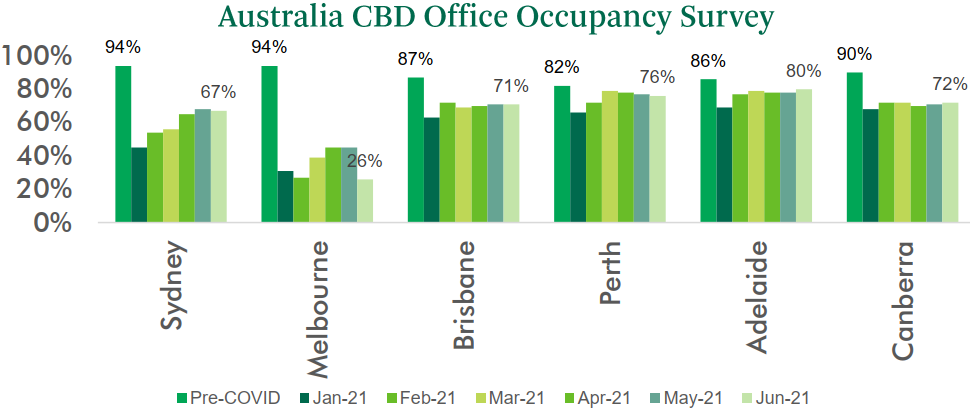
Many people must be thinking about how to escape the extreme shutdowns, be it for economic, health (!), or philosophical reasons – such a trend has indeed been in full swing in the US where people are escaping CA/NY and headed to FL/TX. In our Australian example above, Perth has had little to no draconian shutdowns throughout the crisis (although recent trends are not promising, see Chart 9), further helped by a nascent bull market in the commodities sector to which the region is heavily exposed.
It is little surprise therefore to see the Perth economy on a much surer footing, as evidenced by CBD office occupancies – down 6ppts from pre-lockdown levels having bounced back from end-20 lows (Chart 10).
This is in strong contrast to Melbourne’s 68ppt drop in CBD office occupancy to 26% in Jun-21 – the implications of this exodus on future higher debts/taxes cannot be ignored – for those with Aussie exposures, it is certainly time you sold Melbourne and bought Perth.
Chart 9: Perth nearly normal except retail/recreation, work just below normal for a year too
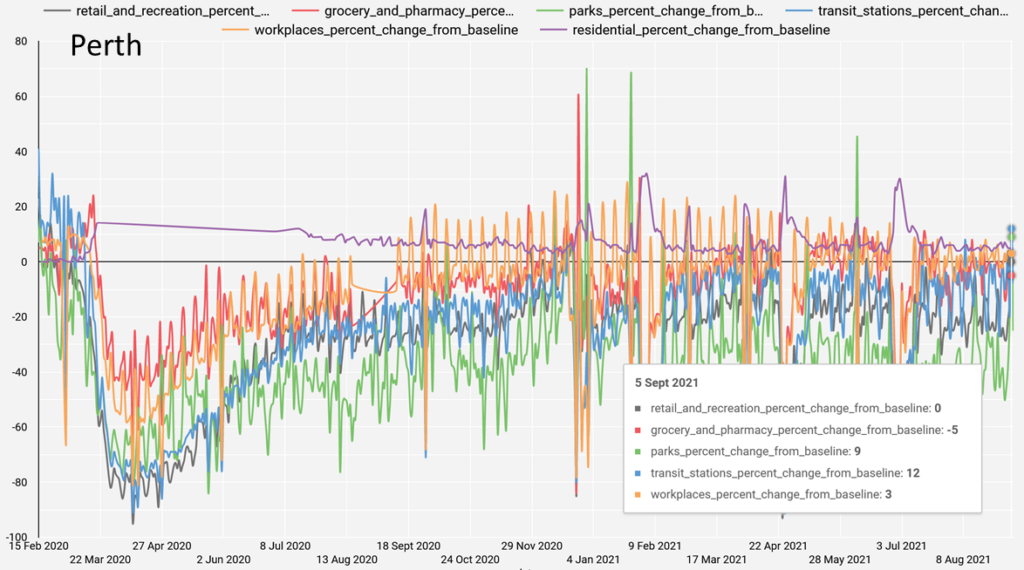
Chart 10: Melbourne wiped out, Perth closest to full recovery vs pre-lockdowns