Obesity & Ageing – where to invest for better returns?
We often hear about the challenges of ageing populations, interspersed with concerned reports about how the developed world is getting fat, with concurrent health problems… But how will these factors impact general economic performance, and along with them, investment returns? This article tries to look into the phenomena in a combined fashion and assess which countries might be potential winners if current trends were to continue…
OECD markets ageing fast, Asia peaking soon…
With the rapid ageing of the working population, the world is faced with not only declining productivity, but also increased healthcare costs. As Chart 1 shows, both Europe and N America have already seen the peak in working population ratios (purple and black lines), suggesting the prime of productivity might be over.
Chart 1: Europe/N America past peak in working age population, Asia still rising into mid 2020s
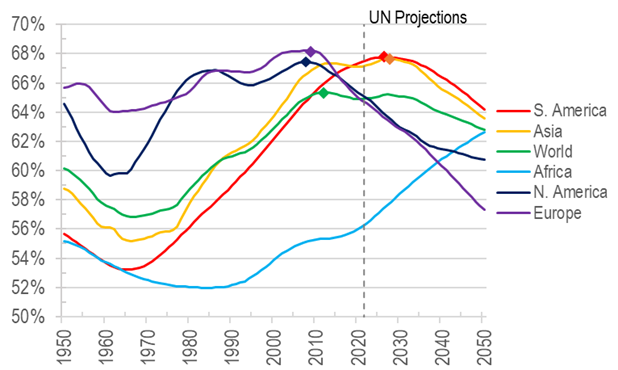
Asia and S America in the meantime are still on the ascent, with rising proportion of working age population until at least the middle of the current decade. For the most favourable demographics, Africa is the top continent, with no end in sight of the rise in workers in at least the next 30 years…
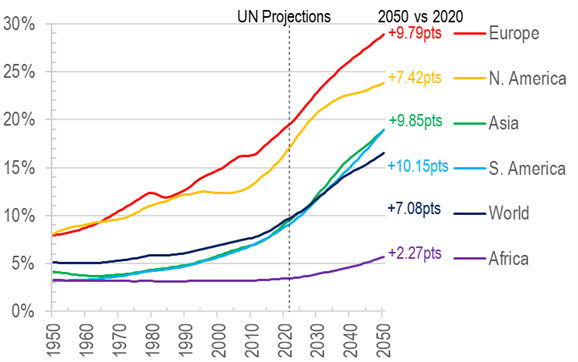
Viewed another way, the drag on the economies from rising old age is demonstrated below again with Europe having the most severe increases in aged population, rising almost 10ppts between 2020 and 2050 (Chart 2), while Africa will only see less than 3ppts in increase to a still very low absolute figure over the next 30 years:
Chart 2: Europe again heads the table of elderly population, suggesting diminished vibrancy
Older and fatter – not a favourable combination?
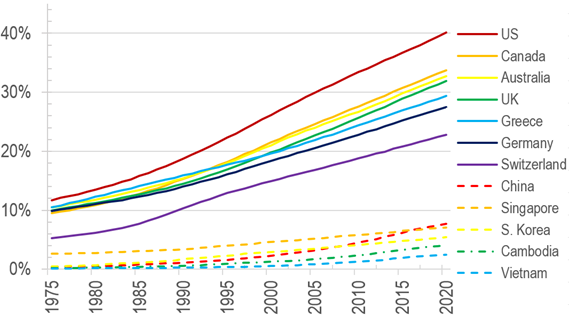
Another factor to gauge the economic vibrancy might be how healthy the population is at large. One of the most readily available measure in this regard is the obesity ratio by country – generally the more obese the people are, the more economically stale they may be, and more sickness prone they get. Unfortunately again, the OECD (ie Europe + US) lead the race in high proportion of obese people, as shown in Chart 3 below:
Chart 3: Obesity Rate (BMI>=30) having been rising across the world from 1975-2020 – but OECD leads by big margin
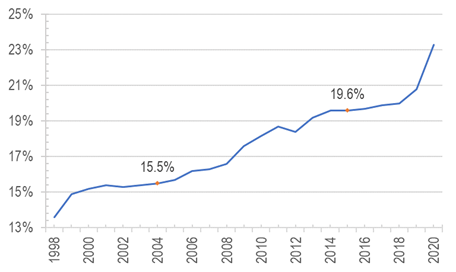
Sadly for Hong Kong, the obesity measures are surging as well, with the proportion of people over 25 on the BMI measure rising from 21% in 2004 to 30% in 2015 (last available data, Chart 4), and even the youngster population cannot escape the fate – where the rise in obesity rate is also alarmingly rapid from 16% to 20% over the same period, Chart 5):
Chart 4: Hong Kong’s adult overweight and obesity rates rose between 2004 and 2015
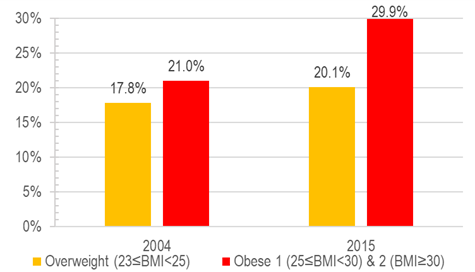
Chart 5: Hong Kong secondary school student overweight and obesity also surging
Work affected when more are obese
In order to establish whether the level of obesity is indeed a contributing factor to economic performance, we have looked at the pattern in Europe, where there is data for absenteeism and obesity, allowing us to establish whether these two variables are correlated:
Chart 6: obesity seems to correlate with absenteeism from work due to illness (unit: days per employee per year, 2020)
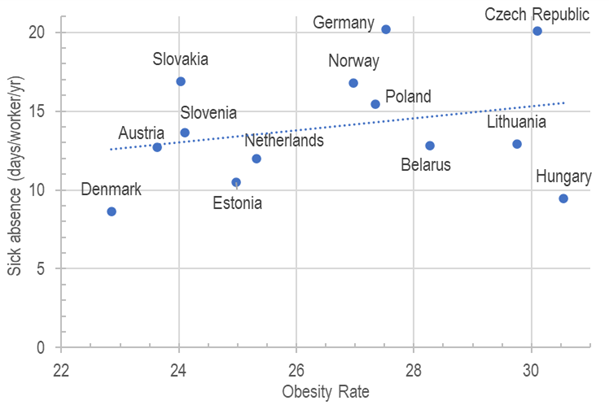
Although further studies may be needed to establish a causality, but a clear correlation exists for the European countries between high obesity rate and number of sick absences. Indeed, this conclusion is supported by other studies, such as the World Obesity Federation’s prediction that economic burden brought by obesity and overweight on the global economy would rise from 2.19% of GDP in 2019 to 3.3% by 2060.
Avoid old and obese, prefer young and fit countries?
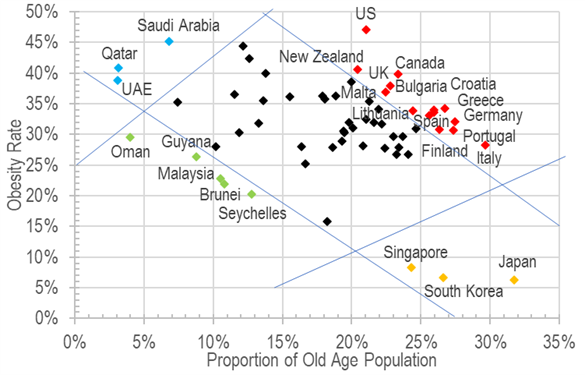
Combining these two variables in typical management consultant 2×2 matrix presentation, we arrive at the spectrum shown in Chart 7 – where:
· the red marks indicate countries with both old and obese populations, which are again mostly OECD countries in Europe/N America;
· while on the opposite end with green marks are countries low in obesity rates and young populations – mostly developing countries in the southern hemisphere;
· between these extremes are old and ‘fit’ populations (orange marks), dominated by developed Asia; and
· finally we have the young but unfit jurisdictions, unsurprisingly mostly Middle Eastern oil states (blue marks)…
Chart 7: avoid red and head for green countries? Or is the obesity a sign of economic success?
While we may have existing state of obesity and age as a measure, perhaps it is more relevant to see the possible trend increase in the coming years for assessing investment return potentials. And with this in mind, we have found the projected future ageing trend as well as obesity trajectories:
Chart 8: Old Age Proportion Increase VS Obesity Rate Increase in 10 years
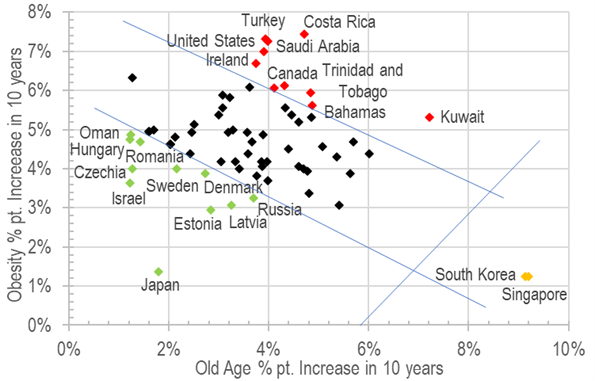
Source: UN Population Division, WHO, Global Health Observatory
Again, we can make similar colour based observations as follows:
· the red marks indicate countries with the highest increases in both old and obese populations, here dominated by N America countries with a strong show of the Caribbean states;
· on the opposite end of the spectrum with green marks are mostly East and Nordic European countries;
· between these extremes are ageing fast but ‘staying fit’ populations (orange marks), still dominated by developed Asia.
Perhaps the clearest trend that emerges from the above studies is that OECD countries, especially N America would see the most challenge (subject to the forecasters being correct), while S Asia and East European countries being the more dynamic jurisdictions to head for – both being developing economies. Does this suggest that the age of the emerging economies have finally arrived?
Go East and South…?
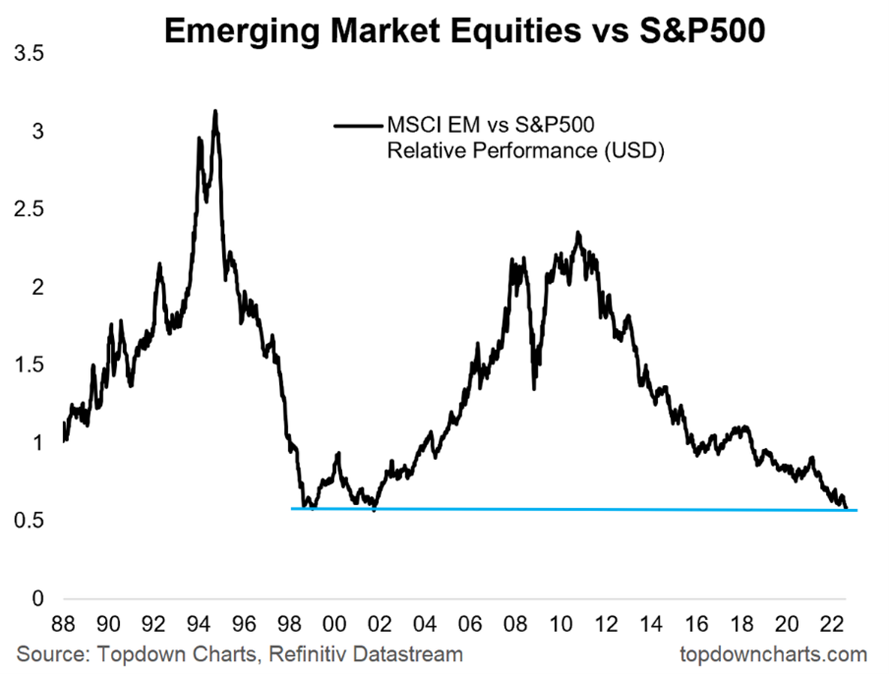
The above conclusions, coupled with the record low emerging market equity valuations vs S&P500 (as a proxy for developed market stocks, Chart 9), does make the age-health twin axis look doubly appealing for emerging market investing…
Chart 9: Emerging Market Equities vs S&P500
The author would like to thank Wong Ngai Fung Wallace from The University of Hong Kong majoring in Wealth Management and So Ka Chun from The Chinese University of Hong Kong majoring in Financial Technology for assisting in data collection, analysis, and drafting this article.